
Page 151 - Moreno Valley 2025 Annual Financial Report
P. 151
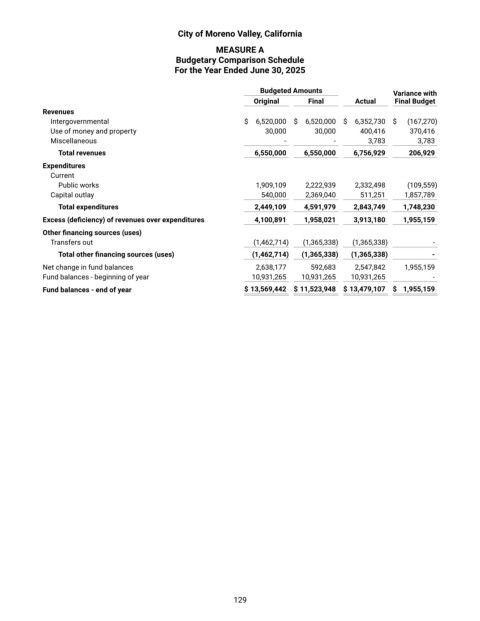
City of Moreno Valley, California

                                                        MEASURE A
                                              Budgetary Comparison Schedule
                                              For the Year Ended June 30, 2025

                                                                   Budgeted Amounts                    Variance with
                                                                  Original      Final       Actual     Final Budget
            Revenues
              Intergovernmental                                  $  6,520,000    $  6,520,000    $  6,352,730    $   (167,270)
              Use of money and property                              30,000        30,000        400,416        370,416
              Miscellaneous                                               -           -         3,783        3,783
                Total revenues                                     6,550,000      6,550,000      6,756,929      206,929
            Expenditures
              Current
                Public works                                         1,909,109        2,222,939        2,332,498        (109,559)
              Capital outlay                                         540,000        2,369,040        511,251        1,857,789
                Total expenditures                                 2,449,109      4,591,979      2,843,749      1,748,230
            Excess (deficiency) of revenues over expenditures       4,100,891      1,958,021      3,913,180      1,955,159
            Other financing sources (uses)
              Transfers out                                          (1,462,714)       (1,365,338)       (1,365,338)       -


                Total other financing sources (uses)              (1,462,714)    (1,365,338)    (1,365,338)     -

            Net change in fund balances                              2,638,177        592,683        2,547,842        1,955,159


            Fund balances - beginning of year                     10,931,265     10,931,265     10,931,265        -

            Fund balances - end of year                           $ 13,569,442     $ 11,523,948     $ 13,479,107     $  1,955,159


                                                             129