
Page 168 - Moreno Valley 2025 Annual Financial Report
P. 168
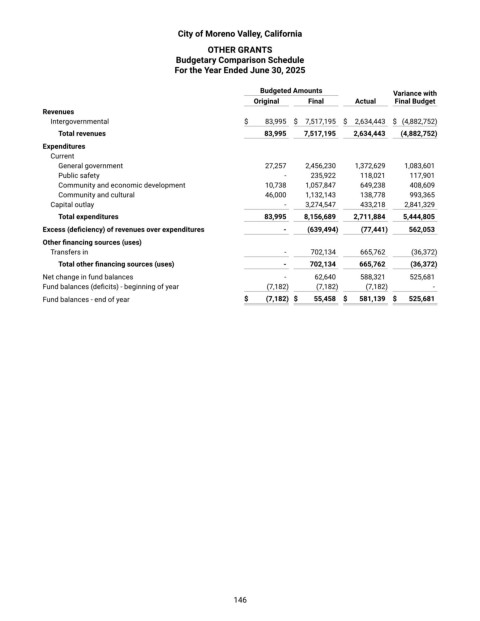
City of Moreno Valley, California

                                                      OTHER GRANTS
                                              Budgetary Comparison Schedule
                                              For the Year Ended June 30, 2025

                                                                   Budgeted Amounts                    Variance with
                                                                  Original      Final       Actual     Final Budget
            Revenues
              Intergovernmental                                  $   83,995    $  7,517,195    $  2,634,443    $  (4,882,752)
                Total revenues                                      83,995      7,517,195      2,634,443     (4,882,752)

            Expenditures
              Current
                General government                                   27,257        2,456,230        1,372,629        1,083,601
                Public safety                                             -         235,922        118,021        117,901
                Community and economic development                   10,738        1,057,847        649,238        408,609
                Community and cultural                               46,000        1,132,143        138,778        993,365
              Capital outlay                                              -         3,274,547        433,218        2,841,329
                Total expenditures                                  83,995      8,156,689      2,711,884      5,444,805
            Excess (deficiency) of revenues over expenditures            -      (639,494)     (77,441)     562,053
            Other financing sources (uses)
              Transfers in                                                -         702,134        665,762        (36,372)
                Total other financing sources (uses)                     -      702,134      665,762      (36,372)
            Net change in fund balances                                   -         62,640        588,321        525,681
            Fund balances (deficits) - beginning of year             (7,182)       (7,182)       (7,182)       -
            Fund balances - end of year                           $  (7,182)    $  55,458     $  581,139     $  525,681


                                                             146