Page 196 - Moreno Valley 2025 Annual Financial Report
P. 196

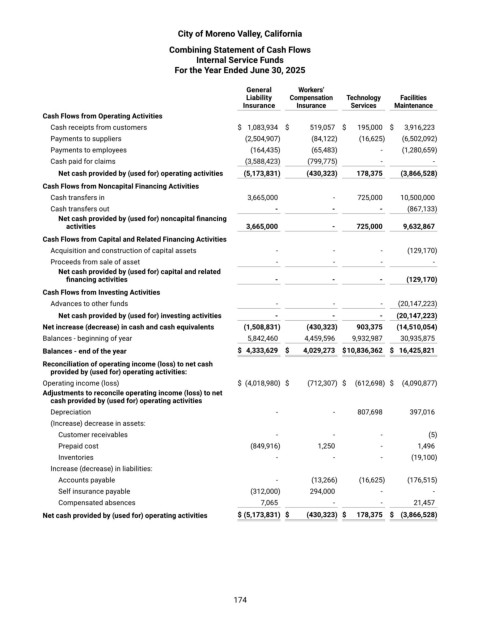
City of Moreno Valley, California

                                            Combining Statement of Cash Flows
                                                   Internal Service Funds
                                              For the Year Ended June 30, 2025


                                                                General      Workers’
                                                                Liability   Compensation   Technology   Facilities
                                                               Insurance     Insurance    Services    Maintenance
            Cash Flows from Operating Activities
              Cash receipts from customers                    $  1,083,934   $   519,057    $   195,000    $   3,916,223
              Payments to suppliers                             (2,504,907)     (84,122)       (16,625)       (6,502,092)
              Payments to employees                              (164,435)      (65,483)          -         (1,280,659)
              Cash paid for claims                              (3,588,423)     (799,775)         -            -
                Net cash provided by (used for) operating activities      (5,173,831)   (430,323)     178,375      (3,866,528)
            Cash Flows from Noncapital Financing Activities
              Cash transfers in                                  3,665,000            -         725,000        10,500,000
              Cash transfers out                                       -              -           -        (867,133)
                Net cash provided by (used for) noncapital financing
                  activities                                    3,665,000             -      725,000      9,632,867
            Cash Flows from Capital and Related Financing Activities
              Acquisition and construction of capital assets           -              -           -         (129,170)
              Proceeds from sale of asset                              -              -           -            -
                Net cash provided by (used for) capital and related
                  financing activities                                 -              -           -      (129,170)
            Cash Flows from Investing Activities
              Advances to other funds                                  -              -           -      (20,147,223)

                Net cash provided by (used for) investing activities     -            -           -     (20,147,223)

            Net increase (decrease) in cash and cash equivalents      (1,508,831)   (430,323)     903,375     (14,510,054)

            Balances ‐ beginning of year                         5,842,460      4,459,596        9,932,987        30,935,875
            Balances ‐ end of the year                        $  4,333,629   $  4,029,273     $ 10,836,362     $  16,425,821
            Reconciliation of operating income (loss) to net cash
              provided by (used for) operating activities:
            Operating income (loss)                           $  (4,018,980)  $   (712,307)   $   (612,698)   $  (4,090,877)
            Adjustments to reconcile operating income (loss) to net
              cash provided by (used for) operating activities
              Depreciation                                             -              -         807,698        397,016
              (Increase) decrease in assets:
                Customer receivables                                   -              -           -           (5)
                Prepaid cost                                     (849,916)        1,250           -         1,496
                Inventories                                            -              -           -         (19,100)
              Increase (decrease) in liabilities:
                Accounts payable                                       -        (13,266)       (16,625)       (176,515)
                Self insurance payable                           (312,000)      294,000           -            -
                Compensated absences                               7,065              -           -         21,457
            Net cash provided by (used for) operating activities    $ (5,173,831)  $  (430,323)    $  178,375     $  (3,866,528)


                                                             174
   191   192   193   194   195   196   197   198   199   200   201