Page 197 - Moreno Valley 2025 Annual Financial Report
P. 197

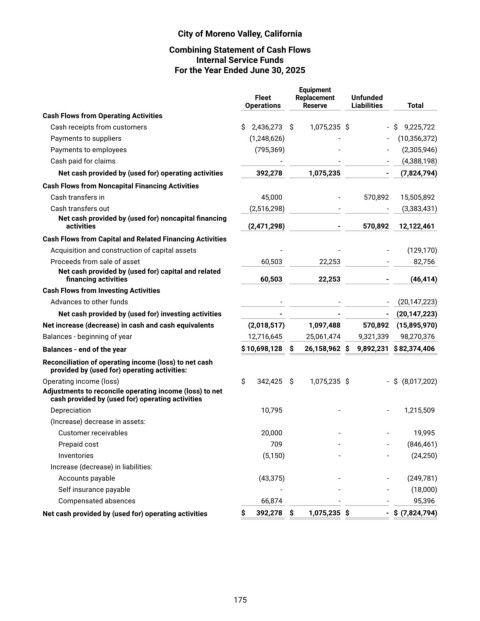
City of Moreno Valley, California

                                            Combining Statement of Cash Flows
                                                   Internal Service Funds
                                              For the Year Ended June 30, 2025


                                                                             Equipment
                                                                  Fleet     Replacement    Unfunded
                                                                Operations    Reserve      Liabilities   Total
            Cash Flows from Operating Activities
              Cash receipts from customers                     $  2,436,273    $   1,075,235   $    -   $  9,225,722
              Payments to suppliers                              (1,248,626)           -            -       (10,356,372)
              Payments to employees                               (795,369)            -            -       (2,305,946)
              Cash paid for claims                                       -             -            -       (4,388,198)
                Net cash provided by (used for) operating activities     392,278      1,075,235     -     (7,824,794)
            Cash Flows from Noncapital Financing Activities
              Cash transfers in                                     45,000             -        570,892     15,505,892
              Cash transfers out                                 (2,516,298)           -            -       (3,383,431)
                Net cash provided by (used for) noncapital financing
                  activities                                     (2,471,298)           -      570,892     12,122,461
            Cash Flows from Capital and Related Financing Activities
              Acquisition and construction of capital assets             -             -            -        (129,170)
              Proceeds from sale of asset                           60,503        22,253            -        82,756
                Net cash provided by (used for) capital and related
                  financing activities                             60,503         22,253            -     (46,414)
            Cash Flows from Investing Activities
              Advances to other funds                                    -             -            -       (20,147,223)
                Net cash provided by (used for) investing activities     -             -            -     (20,147,223)
            Net increase (decrease) in cash and cash equivalents      (2,018,517)     1,097,488     570,892     (15,895,970)
            Balances ‐ beginning of year                         12,716,645       25,061,474      9,321,339     98,270,376
            Balances ‐ end of the year                         $ 10,698,128     $  26,158,962    $  9,892,231    $ 82,374,406
            Reconciliation of operating income (loss) to net cash
              provided by (used for) operating activities:
            Operating income (loss)                            $   342,425    $   1,075,235   $     -   $  (8,017,202)
            Adjustments to reconcile operating income (loss) to net
              cash provided by (used for) operating activities
              Depreciation                                          10,795             -            -        1,215,509
              (Increase) decrease in assets:
                Customer receivables                                20,000             -            -        19,995
                Prepaid cost                                          709              -            -        (846,461)
                Inventories                                         (5,150)            -            -        (24,250)
              Increase (decrease) in liabilities:
                Accounts payable                                   (43,375)            -            -        (249,781)
                Self insurance payable                                   -             -            -        (18,000)
                Compensated absences                                66,874             -            -        95,396
            Net cash provided by (used for) operating activities    $  392,278     $  1,075,235    $  -    $  (7,824,794)


                                                             175
   192   193   194   195   196   197   198   199   200   201   202