Page 100 - Moreno Valley 2025 Annual Financial Report
P. 100

City of Moreno Valley, California

                                               Notes to Financial Statements
                                              For the Year Ended June 30, 2025

            Note 9.    Other Post Employment Benefits (OPEB) (Continued)

                       Discount rate

                       The discount rate used to measure the total OPEB liability is 6.40%. This is the expected
                       long-term rate of return on City assets using the Strategy I asset allocation provided by
                       California Employers’ Retiree Benefit Trust (CERBT). The projection of cash flows used to
                       determine the discount rate assumed that the City contribution will be made at rates equal
                       to the actuarially determined contribution rates. Base on those assumptions, the OPEB plan’s
                       fiduciary net position is projected to cover all future OPEB payments. Therefore, the discount
                       rate was set equal to the long-term expected rate of return.


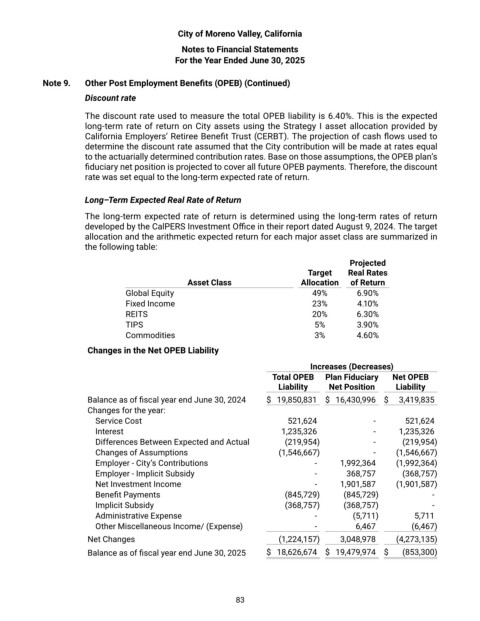
                       Long–Term Expected Real Rate of Return

                       The long-term expected rate of return is determined using the long-term rates of return
                       developed by the CalPERS Investment Office in their report dated August 9, 2024. The target
                       allocation and the arithmetic expected return for each major asset class are summarized in
                       the following table:

                                                                                          Projected
                                                                                Target    Real Rates
                                                 Asset Class                  Allocation   of Return
                                 Global Equity                                   49%        6.90%
                                 Fixed Income                                    23%        4.10%
                                 REITS                                           20%        6.30%
                                 TIPS                                            5%         3.90%
                                 Commodities                                     3%         4.60%

                       Changes in the Net OPEB Liability

                                                                                Increases (Decreases)
                                                                      Total OPEB    Plan Fiduciary   Net OPEB
                                                                        Liability    Net Position     Liability
                       Balance as of fiscal year end June 30, 2024    $  19,850,831   $  16,430,996   $   3,419,835
                       Changes for the year:
                         Service Cost                                     521,624               -       521,624
                         Interest                                        1,235,326              -       1,235,326
                         Differences Between Expected and Actual          (219,954)             -       (219,954)
                         Changes of Assumptions                          (1,546,667)            -       (1,546,667)
                         Employer - City’s Contributions                         -       1,992,364      (1,992,364)
                         Employer - Implicit Subsidy                             -       368,757        (368,757)
                         Net Investment Income                                   -       1,901,587      (1,901,587)
                         Benefit Payments                                 (845,729)      (845,729)             -
                         Implicit Subsidy                                 (368,757)      (368,757)             -
                         Administrative Expense                                  -         (5,711)         5,711
                         Other Miscellaneous Income/ (Expense)                   -          6,467         (6,467)
                       Net Changes                                       (1,224,157)     3,048,978      (4,273,135)
                       Balance as of fiscal year end June 30, 2025    $  18,626,674   $  19,479,974   $   (853,300)


                                                             83
   95   96   97   98   99   100   101   102   103   104   105