
Page 99 - Moreno Valley 2025 Annual Financial Report
P. 99
City of Moreno Valley, California
Notes to Financial Statements
For the Year Ended June 30, 2025
Note 9. Other Post Employment Benefits (OPEB) (Continued)
Net OPEB Liability
The City’s total OPEB liability was valued as of June 30, 2024 and was used to calculate the
net OPEB liability measured as of June 30, 2024.
Actuarial Assumptions
This valuation assumes that the City will fund the OPEB benefits using the ADC each year,
with the ADC calculated as the sum of the Entry Age Normal Cost (cash subsidy only) for
the year plus amortization of the Unfunded Actuarial Accrued Liability (UAAL) and estimated
administrative expenses. The Normal Cost is the portion of the Actuarial Present Value of
benefits allocated to a valuation year. The UAAL is the excess of the Entry Age Normal Actuarial
Accrued Liability over the Market Value of Assets.
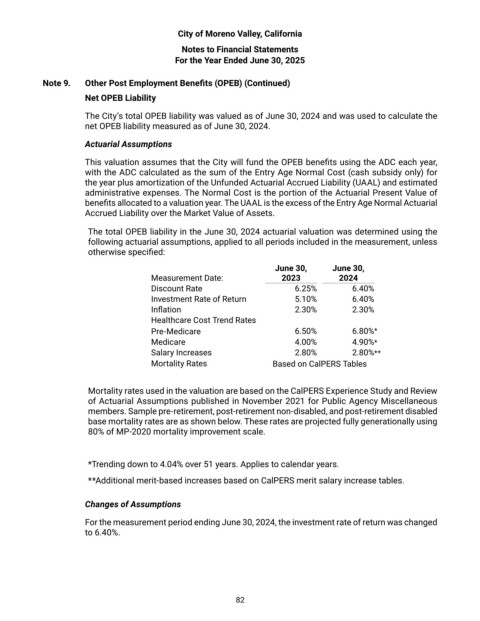
The total OPEB liability in the June 30, 2024 actuarial valuation was determined using the
following actuarial assumptions, applied to all periods included in the measurement, unless
otherwise specified:
June 30, June 30,
Measurement Date: 2023 2024
Discount Rate 6.25% 6.40%
Investment Rate of Return 5.10% 6.40%
Inflation 2.30% 2.30%
Healthcare Cost Trend Rates
Pre-Medicare 6.50% 6.80%*
Medicare 4.00% 4.90%*
Salary Increases 2.80% 2.80%**
Mortality Rates Based on CalPERS Tables
Mortality rates used in the valuation are based on the CalPERS Experience Study and Review
of Actuarial Assumptions published in November 2021 for Public Agency Miscellaneous
members. Sample pre-retirement, post-retirement non-disabled, and post-retirement disabled
base mortality rates are as shown below. These rates are projected fully generationally using
80% of MP-2020 mortality improvement scale.
*Trending down to 4.04% over 51 years. Applies to calendar years.
**Additional merit-based increases based on CalPERS merit salary increase tables.
Changes of Assumptions
For the measurement period ending June 30, 2024, the investment rate of return was changed
to 6.40%.
82