
Page 94 - Moreno Valley 2025 Annual Financial Report
P. 94
City of Moreno Valley, California
Notes to Financial Statements
For the Year Ended June 30, 2025
Note 8. Employee Pension Plan (Continued)
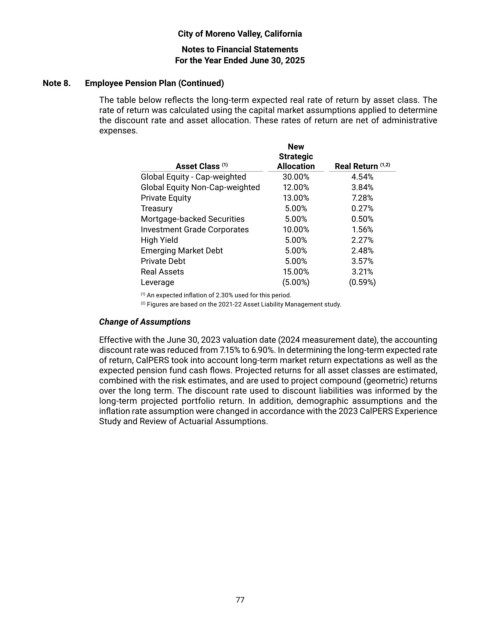
The table below reflects the long-term expected real rate of return by asset class. The
rate of return was calculated using the capital market assumptions applied to determine
the discount rate and asset allocation. These rates of return are net of administrative
expenses.
New
Strategic
Asset Class (1) Allocation Real Return (1,2)
Global Equity - Cap-weighted 30.00% 4.54%
Global Equity Non-Cap-weighted 12.00% 3.84%
Private Equity 13.00% 7.28%
Treasury 5.00% 0.27%
Mortgage-backed Securities 5.00% 0.50%
Investment Grade Corporates 10.00% 1.56%
High Yield 5.00% 2.27%
Emerging Market Debt 5.00% 2.48%
Private Debt 5.00% 3.57%
Real Assets 15.00% 3.21%
Leverage (5.00%) (0.59%)
(1) An expected inflation of 2.30% used for this period.
(2) Figures are based on the 2021-22 Asset Liability Management study.
Change of Assumptions
Effective with the June 30, 2023 valuation date (2024 measurement date), the accounting
discount rate was reduced from 7.15% to 6.90%. In determining the long-term expected rate
of return, CalPERS took into account long-term market return expectations as well as the
expected pension fund cash flows. Projected returns for all asset classes are estimated,
combined with the risk estimates, and are used to project compound (geometric) returns
over the long term. The discount rate used to discount liabilities was informed by the
long-term projected portfolio return. In addition, demographic assumptions and the
inflation rate assumption were changed in accordance with the 2023 CalPERS Experience
Study and Review of Actuarial Assumptions.
77