
Page 111 - Moreno Valley 2025 Annual Financial Report
P. 111
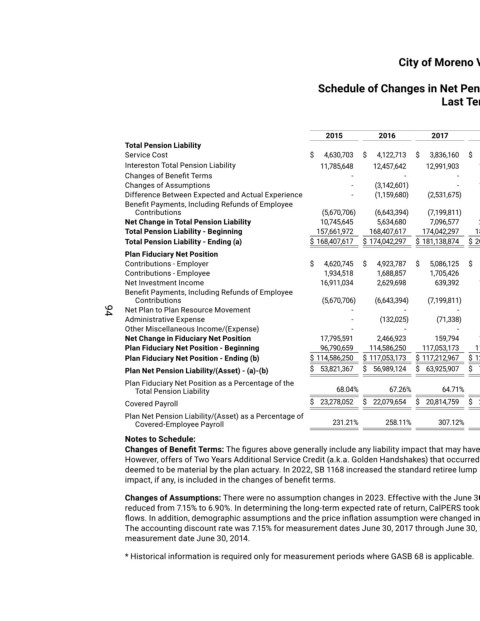
City of Moreno Valley, California


                                                                                  Schedule of Changes in Net Pension Liability and Related Ratios
                                                                                                                  Last Ten Years*


                                                                                                                                   Measurement Period ended June 30
                                                                                    2015          2016         2017          2018         2019          2020         2021          2022         2023          2024
                                 Total Pension Liability
                                 Service Cost                                    $   4,630,703   $   4,122,713   $   3,836,160   $   4,154,188   $   4,096,701   $   4,421,787   $   4,706,624   $   4,410,902   $   4,610,295   $   4,769,622
                                 Intereston Total Pension Liability                 11,785,648      12,457,642      12,991,903      13,608,182      14,018,703      15,737,260      16,516,203      16,903,144      17,744,011      18,456,957
                                 Changes of Benefit Terms                                  -            -             -            -             -            -             -            -       306,426            -
                                 Changes of Assumptions                                    -       (3,142,601)        -       11,559,898      (1,695,079)      -            -       8,512,485          -            -
                                 Difference Between Expected and Actual Experience         -       (1,159,680)      (2,531,675)      (566,196)      (2,163,560)      1,544,561      876,743      (4,439,439)      2,841,506      1,422,588
                                 Benefit Payments, Including Refunds of Employee
                                   Contributions                                    (5,670,706)      (6,643,394)      (7,199,811)      (7,770,872)      (8,495,988)      (9,934,145)     (10,633,661)     (11,707,851)     (13,042,533)     (14,005,505)
                                 Net Change in Total Pension Liability              10,745,645      5,634,680      7,096,577      20,985,200      5,760,777      11,769,463      11,465,909      13,679,241      12,459,705      10,643,662
                                 Total Pension Liability - Beginning               157,661,972     168,407,617     174,042,297     181,138,874     202,124,074     221,313,159     233,082,622     244,548,531     258,227,772     270,687,477
                                 Total Pension Liability - Ending (a)            $ 168,407,617   $ 174,042,297   $ 181,138,874   $ 202,124,074   $ 207,884,851   $ 233,082,622   $ 244,548,531   $ 258,227,772   $ 270,687,477   $ 281,331,139
                                 Plan Fiduciary Net Position
                                 Contributions - Employer                        $   4,620,745   $   4,923,787   $   5,086,125   $   5,743,170   $   6,385,610   $   7,971,246   $   8,002,625   $   9,026,559   $  10,016,695   $  10,551,435
                                 Contributions - Employee                           1,934,518      1,688,857      1,705,426      1,676,844      1,721,640      1,801,643      1,414,837      1,659,557      1,787,788      2,308,151
                                 Net Investment Income                              16,911,034      2,629,698      639,392      13,032,362      11,053,578      7,444,800      35,531,661     (14,386,583)      10,916,480      17,788,583
                                 Benefit Payments, Including Refunds of Employee
                                   Contributions                                    (5,670,706)      (6,643,394)      (7,199,811)      (7,770,872)      (8,495,988)      (9,934,145)     (10,633,661)     (11,707,851)     (13,042,533)     (14,005,505)
                                 Net Plan to Plan Resource Movement                        -            -             -        (7,368)        (323)           -             -            -             -            -
                                 Administrative Expense                                    -       (132,025)      (71,338)      (173,057)      (202,130)      (209,231)      (155,326)      (118,141)      (128,043)      (149,457)
                            94
                                 Other Miscellaneous Income/(Expense)                      -            -             -            -       (383,849)          -             -            -             -            -
                                 Net Change in Fiduciary Net Position               17,795,591      2,466,923      159,794      12,501,079      10,078,538      7,074,313      34,160,136     (15,526,459)      9,550,387      16,493,207
                                 Plan Fiduciary Net Position - Beginning            96,790,659     114,586,250     117,053,173     117,212,967     129,714,046     148,416,886     155,491,199     189,651,335     174,124,876     183,675,263
                                 Plan Fiduciary Net Position - Ending (b)        $ 114,586,250   $ 117,053,173   $ 117,212,967   $ 129,714,046   $ 139,792,584   $ 155,491,199   $ 189,651,335   $ 174,124,876   $ 183,675,263   $ 200,168,470
                                 Plan Net Pension Liability/(Asset) - (a)-(b)    $  53,821,367   $  56,989,124   $  63,925,907   $  72,410,028   $  68,092,267   $  77,591,423   $  54,897,196   $  84,102,896   $  87,012,214   $  81,162,669
                                 Plan Fiduciary Net Position as a Percentage of the
                                   Total Pension Liability                             68.04%       67.26%        64.71%       64.18%        67.25%       66.71%        77.55%       67.43%        67.86%       71.15%
                                 Covered Payroll                                 $  23,278,052   $  22,079,654   $  20,814,759   $  20,793,815   $  20,860,026   $  23,174,982   $  24,680,774   $  21,728,582   $  23,776,664   $  25,343,369
                                 Plan Net Pension Liability/(Asset) as a Percentage of
                                   Covered-Employee Payroll                           231.21%      258.11%       307.12%      348.23%       326.42%      334.81%       222.43%      387.06%       365.96%      320.25%
                                 Notes to Schedule:
                                 Changes of Benefit Terms: The figures above generally include any liability impact that may have resulted from voluntary benefit changes that occurred on or before the Measurement Date.
                                 However, offers of Two Years Additional Service Credit (a.k.a. Golden Handshakes) that occurred after the Valuation Date are not included in the figures above, unless the liability impact is
                                 deemed to be material by the plan actuary. In 2022, SB 1168 increased the standard retiree lump sum death benefit from $500 to $2,000 for any death occurring on or after July 1, 2023. The
                                 impact, if any, is included in the changes of benefit terms.

                                 Changes of Assumptions: There were no assumption changes in 2023. Effective with the June 30, 2021 valuation date (June 30, 2022 measurement date), the accounting discount rate was
                                 reduced from 7.15% to 6.90%. In determining the long-term expected rate of return, CalPERS took into account long-term market return expectations as well as the expected pension fund cash
                                 flows. In addition, demographic assumptions and the price inflation assumption were changed in accordance with the 2021 CalPERS Experience Study and Review of Actuarial Assumptions.
                                 The accounting discount rate was 7.15% for measurement dates June 30, 2017 through June 30, 2021, 7.65% for measurement dates June 30, 2015 through June 30, 2016, and 7.50% for
                                 measurement date June 30, 2014.

                                 * Historical information is required only for measurement periods where GASB 68 is applicable.