
Page 113 - Moreno Valley 2025 Annual Financial Report
P. 113
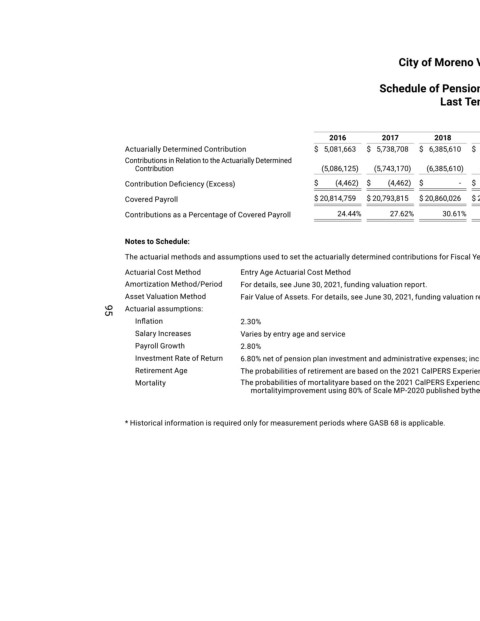
City of Moreno Valley, California


                                                                                                  Schedule of Pension Plan Contributions
                                                                                                                 Last Ten Years*


                                                                                                                                    For the Fiscal Years Ended June 30
                                                                                     2016         2017          2018         2019          2020         2021         2022          2023         2024          2025
                                 Actuarially Determined Contribution              $  5,081,663   $  5,738,708   $  6,385,610   $  7,094,031   $  7,971,246   $  8,002,625   $  9,026,559   $ 10,016,695   $ 10,551,435   $ 11,638,621
                                 Contributions in Relation to the Actuarially Determined
                                   Contribution                                     (5,086,125)     (5,743,170)     (6,385,610)     (7,094,031)     (7,971,246)     (8,002,625)     (9,026,559)     (10,016,695)     (10,551,435)     (11,638,621)
                                 Contribution Deficiency (Excess)                 $    (4,462)   $   (4,462)   $      -   $         -   $        -   $        -   $         -   $        -   $         -   $        -

                                 Covered Payroll                                  $ 20,814,759   $ 20,793,815   $ 20,860,026   $ 21,783,847   $ 23,174,982   $ 24,680,774   $ 21,728,582   $ 23,776,664   $ 25,343,369   $ 32,226,538
                                 Contributions as a Percentage of Covered Payroll       24.44%      27.62%        30.61%       32.57%        34.40%       32.42%        41.54%       42.13%       41.63%        36.12%


                                 Notes to Schedule:
                                 The actuarial methods and assumptions used to set the actuarially determined contributions for Fiscal Year 2023-24 were derived from the June 30, 2021 funding valuation report.
                                 Actuarial Cost Method        Entry Age Actuarial Cost Method
                                 Amortization Method/Period   For details, see June 30, 2021, funding valuation report.
                                 Asset Valuation Method       Fair Value of Assets. For details, see June 30, 2021, funding valuation report.
                                 Actuarial assumptions:
                                   Inflation                  2.30%
                            95
                                   Salary Increases           Varies by entry age and service
                                   Payroll Growth             2.80%
                                   Investment Rate of Return  6.80% net of pension plan investment and administrative expenses; includes inflation.
                                   Retirement Age             The probabilities of retirement are based on the 2021 CalPERS Experience Study and Review of Actuarial Assumptions.
                                   Mortality                  The probabilities of mortalityare based on the 2021 CalPERS Experience Study and Review of Actuarial Assumptions. Mortality rates incorporate full generational
                                                                 mortalityimprovement using 80% of Scale MP-2020 published bythe Society of Actuaries.


                                 * Historical information is required only for measurement periods where GASB 68 is applicable.