Page 117 - Moreno Valley 2025 Annual Financial Report
P. 117

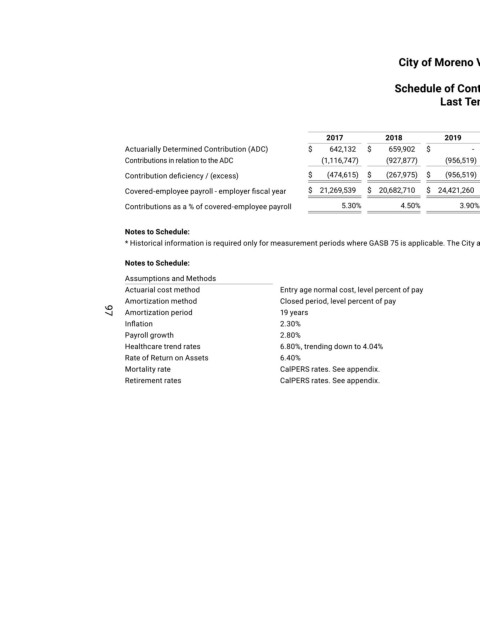
City of Moreno Valley, California


                                                                                                      Schedule of Contributions ‐ OPEB
                                                                                                                 Last Ten Years*


                                                                                    2017           2018           2019           2020            2021           2022           2023           2024           2025
                                 Actuarially Determined Contribution (ADC)      $    642,132   $    659,902   $          -   $    908,656   $   1,114,937   $   1,367,308   $   1,405,197   $   1,090,184   $   793,133
                                 Contributions in relation to the ADC              (1,116,747)      (927,877)      (956,519)      (934,040)      (1,838,078)      (2,005,598)      (1,367,308)      (2,546,531)      (1,406,963)
                                 Contribution deficiency / (excess)             $   (474,615)   $   (267,975)   $   (956,519)   $   (25,384)   $   (723,141)   $   (638,290)   $   37,889   $  (1,456,347)   $   (613,830)

                                 Covered-employee payroll - employer fiscal year    $  21,269,539   $  20,682,710   $  24,421,260   $  21,287,842   $  23,236,495   $  24,579,873   $  22,296,347   $  28,941,720   $  29,752,088
                                 Contributions as a % of covered-employee payroll       5.30%          4.50%          3.90%          4.40%           7.90%          8.20%          6.10%          8.80%          4.73%

                                 Notes to Schedule:
                                 * Historical information is required only for measurement periods where GASB 75 is applicable. The City adopted GASB 75 for the fiscal year ending June 30, 2017.

                                 Notes to Schedule:

                                 Assumptions and Methods
                                 Actuarial cost method                   Entry age normal cost, level percent of pay
                                 Amortization method                     Closed period, level percent of pay
                                 Amortization period                     19 years
                            97
                                 Inflation                               2.30%
                                 Payroll growth                          2.80%
                                 Healthcare trend rates                  6.80%, trending down to 4.04%
                                 Rate of Return on Assets                6.40%
                                 Mortality rate                          CalPERS rates. See appendix.
                                 Retirement rates                        CalPERS rates. See appendix.
   112   113   114   115   116   117   118   119   120   121   122