
Page 120 - Moreno Valley 2025 Annual Financial Report
P. 120
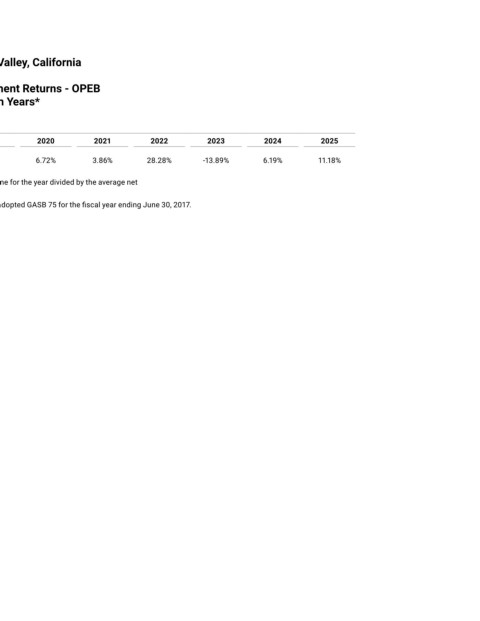
City of Moreno Valley, California


 Schedule of Investment Returns ‐ OPEB
 Last Ten Years*


         2017     2018     2019     2020     2021     2022     2023     2024       2025
 Annual money-weighted rate of return, net of investment
 expense     9.77%     10.24%     -0.70%     6.72%     3.86%     28.28%     -13.89%     6.19%     11.18%

 Notes: The annual money-weighted rate of return, net of investment expenses, is the net investment income for the year divided by the average net
 position for the year (less investment expenses).
 * Historical information is required only for measurement periods where GASB 75 is applicable. The City adopted GASB 75 for the fiscal year ending June 30, 2017.


 98