
Page 115 - Moreno Valley 2025 Annual Financial Report
P. 115
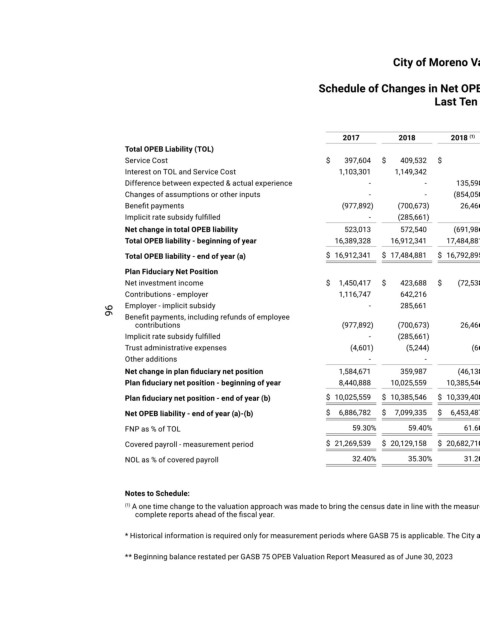
City of Moreno Valley, California


                                                                                  Schedule of Changes in Net OPEB Liability and Related Ratios
                                                                                                                Last Ten Years*


                                                                                        2017           2018         2018  (1)      2019          2020           2021          2022          2023          2024
                                 Total OPEB Liability (TOL)
                                 Service Cost                                        $   397,604   $   409,532   $          -   $   360,905   $   459,956   $   441,404   $   453,543   $    532,469   $   521,624
                                 Interest on TOL and Service Cost                       1,103,301      1,149,342            -       1,212,957      1,178,040      1,250,876      1,272,484      1,189,947      1,235,326
                                 Difference between expected & actual experience               -             -       135,598       (200,112)      475,121       (352,233)      (1,910,420)      (78,408)      (219,954)
                                 Changes of assumptions or other inputs                        -             -       (854,050)      1,961,763      109,418       29,971       438,727       (503,557)     (1,546,667)
                                 Benefit payments                                       (977,892)      (700,673)      26,466       (689,589)      (718,916)      (764,294)      (1,054,058)      (821,387)      (845,729)
                                 Implicit rate subsidy fulfilled                               -       (285,661)            -       (295,036)      (302,476)      (261,323)      (258,562)      (357,836)      (368,757)
                                 Net change in total OPEB liability                      523,013       572,540       (691,986)      2,350,888      1,201,143      344,401      (1,058,286)      (38,772)     (1,224,157)
                                 Total OPEB liability - beginning of year              16,389,328     16,912,341     17,484,881     16,792,895     19,143,783     20,344,926     20,689,327     19,889,603     19,850,831  **
                                 Total OPEB liability - end of year (a)              $  16,912,341   $  17,484,881   $  16,792,895   $  19,143,783   $  20,344,926   $  20,689,327   $  19,631,041   $  19,850,831   $ 18,626,674
                                 Plan Fiduciary Net Position
                                 Net investment income                               $  1,450,417   $   423,688   $   (72,538)   $   670,718    $   421,628    $  3,309,203    $  (2,206,130)    $   918,976    $  1,901,587
                                 Contributions - employer                               1,116,747      642,216              -       661,483       631,564      1,576,755      1,747,036      2,188,695      1,992,364
                                 Employer - implicit subsidy                                   -       285,661              -       295,036       302,476       261,323       258,562        357,836      368,757
                                 Benefit payments, including refunds of employee
                            96
                                   contributions                                        (977,892)      (700,673)      26,466       (689,589)      (718,916)      (764,294)      (1,054,058)      (821,387)      (845,729)
                                 Implicit rate subsidy fulfilled                               -       (285,661)            -       (295,036)      (302,476)      (261,323)      (258,562)      (357,836)      (368,757)
                                 Trust administrative expenses                            (4,601)        (5,244)         (66)        (2,350)       (5,640)        (4,560)       (4,116)       (7,612)       (5,711)
                                 Other additions                                               -             -              -       (10,898)            -             -              -        (3,482)       6,467
                                 Net change in plan fiduciary net position              1,584,671      359,987        (46,138)      629,364       328,636      4,117,104      (1,517,268)      2,275,190      3,048,978
                                 Plan fiduciary net position - beginning of year        8,440,888     10,025,559     10,385,546     10,339,408     10,968,772     11,297,408     15,414,512     14,155,806     16,430,996  **

                                 Plan fiduciary net position - end of year (b)       $  10,025,559   $  10,385,546   $  10,339,408   $  10,968,772   $  11,297,408   $  15,414,512   $  13,897,244   $  16,430,996   $ 19,479,974
                                 Net OPEB liability - end of year (a)-(b)            $  6,886,782   $  7,099,335   $  6,453,487   $  8,175,011   $  9,047,518   $  5,274,815   $  5,733,797   $  3,419,835   $  (853,300)

                                 FNP as % of TOL                                           59.30%        59.40%        61.60%         57.30%        55.50%        74.50%        71.20%         82.80%      104.60%
                                 Covered payroll - measurement period                $  21,269,539   $  20,129,158   $  20,682,710   $  24,421,260   $  21,287,842   $  23,236,495   $  24,579,873   $  22,296,347   $ 28,941,720
                                 NOL as % of covered payroll                               32.40%        35.30%        31.20%         33.50%        42.50%        22.70%        23.30%         15.30%        (2.90%)


                                 Notes to Schedule:
                                 (1)  A one time change to the valuation approach was made to bring the census date in line with the measurement date, and to set the report date one year ahead of the measurement date to allow the City to
                                   complete reports ahead of the fiscal year.

                                 * Historical information is required only for measurement periods where GASB 75 is applicable. The City adopted GASB 75 for the fiscal year ending June 30, 2017.

                                 ** Beginning balance restated per GASB 75 OPEB Valuation Report Measured as of June 30, 2023