
Page 239 - Moreno Valley 2025 Annual Financial Report
P. 239
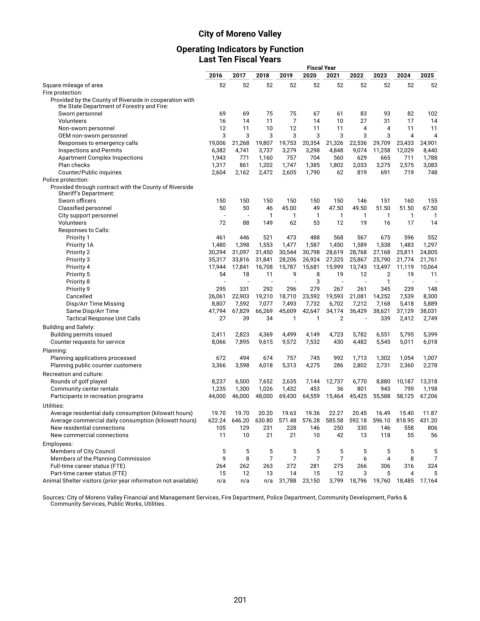
City of Moreno Valley

                                              Operating Indicators by Function
                                                    Last Ten Fiscal Years
                                                                               Fiscal Year
                                                       2016   2017   2018   2019   2020   2021   2022   2023   2024   2025
            Square mileage of area                          52       52       52       52       52       52       52       52       52       52
            Fire protection:
              Provided by the County of Riverside in cooperation with
                the State Department of Forestry and Fire:
                Sworn personnel                             69       69       75       75       67       61       83       93       82     102
                Volunteers                                  16     14     11       7       14     10       27     31       17     14
                Non-sworn personnel                       12     11     10     12     11     11     4     4     11     11
                OEM non-sworn personnel                   3     3     3     3     3     3     3     3     4     4


                Responses to emergency calls             19,006    21,268    19,807    19,753    20,354    21,326    22,536    29,709    23,433    24,901


                Inspections and Permits                  6,382    4,741    3,737    3,279    3,298    4,848    9,074    11,258    12,029    8,440


                Apartment Complex Inspections            1,943       771    1,160       757       704       560       629       665       711    1,788


                Plan checks                              1,317       861    1,202    1,747    1,385    1,802    2,033    3,275    2,575    3,083


                Counter/Public inquiries                 2,604    2,162    2,472    2,605    1,790       62       819       691       719       748
            Police protection:
              Provided through contract with the County of Riverside
                Sheriff’s Department:
                Sworn officers                              150       150       150       150       150       150       146       151       160       155


                Classified personnel                        50       50       46    45.00       49    47.50    49.50    51.50    51.50    67.50

                City support personnel                      -         -       1     1     1     1     1     1     1     1
                Volunteers                                  72       88       149       62       53     12       19       16       17     14
                Responses to Calls:
                  Priority 1                                461       446       521       473       488       568       567       675       596       552


                  Priority 1A                            1,480    1,398    1,553    1,477    1,587    1,450    1,589    1,538    1,483    1,297


                  Priority 2                             30,294    31,097    31,450    30,544    30,798    28,619    28,768    27,168    25,811    24,805


                  Priority 3                             35,317    33,816    31,841    28,206    26,924    27,325    25,867    25,790    21,774    21,761


                  Priority 4                             17,944    17,841    16,708    15,787    15,681    15,999    13,743    13,497    11,119    10,064


                  Priority 5                                54       18     11       9         8         19     12     2       19     11
                  Priority 8                                -         -         -         -       3       -         -       1       -         -
                  Priority 9                                295     331       292       296       279       267       261       345       239       148


                  Cancelled                              26,061    22,903    19,210    18,710    23,592    19,593    21,081    14,252    7,539    8,300


                  Disp/Arr Time Missing                  8,807    7,592    7,077    7,493    7,732    6,702    7,212    7,168    5,418    5,889


                  Same Disp/Arr Time                     47,794    67,829    66,269    45,609    42,647    34,174    36,429    38,621    37,129    38,031


                  Tactical Response Unit Calls              27       39     34     1     1     2       -         339    2,412    2,749


            Building and Safety:


              Building permits issued                    2,411    2,823    4,369    4,499    4,149    4,723    5,782    6,551    5,795    5,399


              Counter requests for service               8,066    7,895    9,615    9,572    7,532     430    4,482    5,545    5,011    6,018


            Planning:


              Planning applications processed               672       494       674       757       745       992    1,713    1,302    1,054    1,007


              Planning public counter customers          3,366    3,598    4,018    5,313    4,275       286    2,802    2,731    2,360    2,278


            Recreation and culture:


              Rounds of golf played                      8,237    6,500    7,652    2,635    7,144    12,737    6,770    8,880    10,187    13,318


              Community center rentals                   1,235    1,300    1,026    1,432       453       36       801       943       799    1,198


              Participants in recreation programs        44,000    46,000    48,000    69,430    64,559    15,464    45,425    55,588    58,125    67,206


            Utilities:


              Average residential daily consumption (kilowatt hours)      19.70    19.70    20.20    19.63    19.36    22.27    20.45    16.49    15.40    11.87


              Average commercial daily consumption (kilowatt hours)      622.24    646.20    630.80    571.48    576.28    585.58    592.18    596.10    818.95    431.20


              New residential connections                   105       129     231       228       146       250     330       146       558       806
              New commercial connections                  11     10     21     21     10     42     13       118       55       56
            Employees:
              Members of City Council                       5         5         5         5         5         5         5         5         5         5
              Members of the Planning Commission            9         8         7         7         7         7         6       4       8         7
              Full-time career status (FTE)                 264       262       263       272       281       275       266       306       316     324
              Part-time career status (FTE)                 15     12     13     14       15     12     3       5       4       5


            Animal Shelter visitors (prior year information not available)      n/a     n/a     n/a    31,788    23,150    3,799    18,796    19,760    18,485    17,164

            Sources: City of Moreno Valley Financial and Management Services, Fire Department, Police Department, Community Development, Parks &
              Community Services, Public Works, Utilities.
                                                             201