
Page 237 - Moreno Valley 2025 Annual Financial Report
P. 237
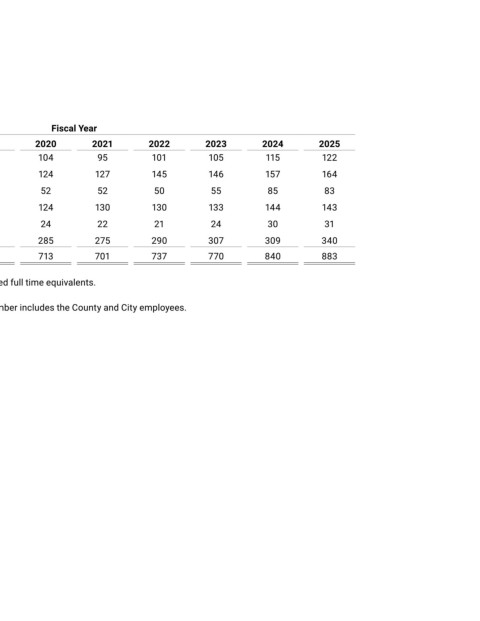
City of Moreno Valley


 Full-time and Part-time City Employees by Function
 Last Ten Fiscal Years


              Fiscal Year

 Function     2016     2017     2018     2019     2020     2021     2022     2023     2024     2025
 General Government     91     101     104     112     104     95     101     105     115     122

 Public Works     118     121     121     121     124     127     145     146     157     164
 Community Development     60     51     60     52     52     52     50     55     85     83

 Parks and Community Services     138     147     149     142     124     130     130     133     144     143

 Animal Services     22     26     22     22     24     22     21     24     30     31
 Public Safety  (1)     284     291     289     289     285     275     290     307     309     340

       713     737     745     738     713     701     737     770     840         883

 This data represents a count of people employed by the City not the number of approved full time equivalents.

 (1)  The City contracts with the County of Riverside for Police and Fire services.  The number includes the County and City employees.

 199
 Source: City of Moreno Valley Financial and Management Services Department