Page 233 - Moreno Valley 2025 Annual Financial Report
P. 233

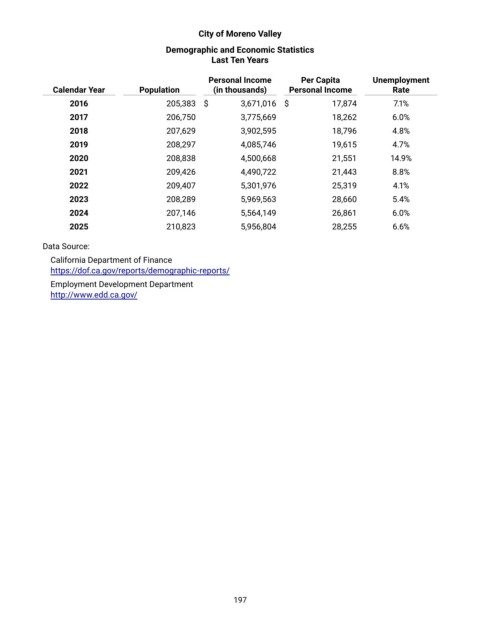
City of Moreno Valley

                                           Demographic and Economic Statistics
                                                       Last Ten Years


                                                      Personal Income         Per Capita        Unemployment
              Calendar Year         Population         (in thousands)      Personal Income           Rate

                   2016                    205,383   $        3,671,016   $           17,874         7.1%
                   2017                    206,750            3,775,669               18,262         6.0%
                   2018                    207,629            3,902,595               18,796         4.8%
                   2019                    208,297            4,085,746               19,615         4.7%
                   2020                    208,838            4,500,668               21,551         14.9%
                   2021                    209,426            4,490,722               21,443         8.8%

                   2022                    209,407            5,301,976               25,319         4.1%
                   2023                    208,289            5,969,563               28,660         5.4%
                   2024                    207,146            5,564,149               26,861         6.0%
                   2025                    210,823            5,956,804               28,255         6.6%

            Data Source:
              California Department of Finance
              https://dof.ca.gov/reports/demographic-reports/
              Employment Development Department
              http://www.edd.ca.gov/


                                                             197
   228   229   230   231   232   233   234   235   236   237   238