
Page 229 - Moreno Valley 2025 Annual Financial Report
P. 229
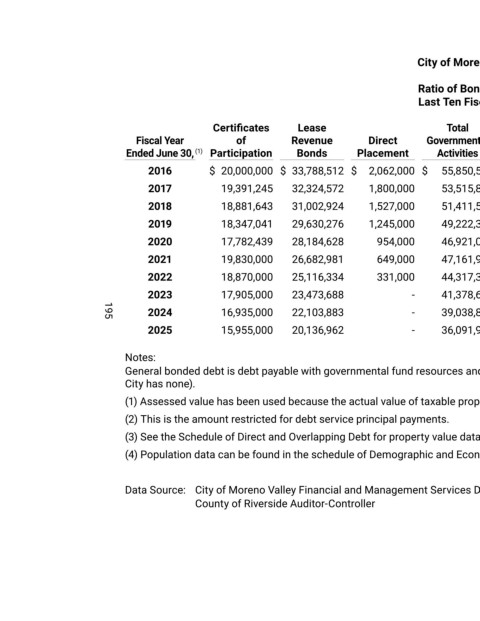
City of Moreno Valley

                                                                                                            Ratio of Bonded Debt
                                                                                                            Last Ten Fiscal Years


                                                       Certificates          Lease                                 Total           Less: Amounts                Net            Percent of
                                    Fiscal Year              of            Revenue             Direct         Governmental        Available in Debt       Governmental         Assessed
                                 Ended June 30,    (1)  Participation        Bonds         Placement             Activities         Service Fund     (2)     Activities           Value      (3)   Per Capita     (4)

                                       2016           $  20,000,000   $  33,788,512   $  2,062,000   $            55,850,512   $          9,734,330       $  46,116,182               0.42%       $          272

                                       2017             19,391,245    32,324,572               1,800,000          53,515,817              6,021,727           47,494,090              0.38%                  259

                                       2018             18,881,643     31,002,924              1,527,000          51,411,567              6,022,962           45,388,605              0.35%                  248

                                       2019             18,347,041    29,630,276               1,245,000          49,222,317              6,023,401           43,198,916              0.31%                  236
                                       2020             17,782,439     28,184,628                954,000          46,921,067              6,021,207           40,899,860              0.27%                  225

                                       2021             19,830,000     26,682,981                649,000          47,161,981              6,224,295           40,937,686              0.26%                  225

                                       2022             18,870,000     25,116,334                331,000          44,317,334              6,021,107           38,296,227              0.23%                  212

                                       2023             17,905,000     23,473,688                         -         41,378,688            6,029,355           35,349,333              0.20%                  199

                                       2024             16,935,000     22,103,883                         -         39,038,883            6,000,813           33,038,070              0.17%                  188
                            195
                                       2025             15,955,000     20,136,962                         -         36,091,962            6,038,300           30,053,662              0.15%                  171

                                 Notes:
                                 General bonded debt is debt payable with governmental fund resources and general obligation bonds recorded in enterprise funds (of which the
                                 City has none).

                                 (1) Assessed value has been used because the actual value of taxable property is not readily available in the State of California.

                                 (2) This is the amount restricted for debt service principal payments.
                                 (3) See the Schedule of Direct and Overlapping Debt for property value data.

                                 (4) Population data can be found in the schedule of Demographic and Economic Statistics.


                                 Data Source: City of Moreno Valley Financial and Management Services Department
                                                   County of Riverside Auditor-Controller