
Page 228 - Moreno Valley 2025 Annual Financial Report
P. 228
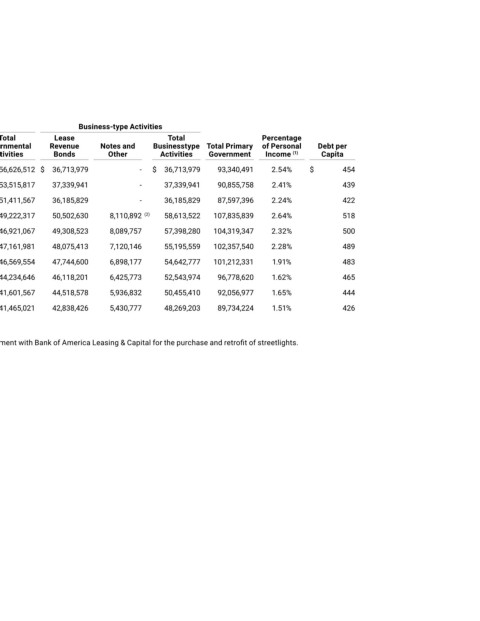
City of Moreno Valley


 Ratios of Outstanding Debt by Type
 Last Ten Fiscal Years


 Governmental Activities     Business-type Activities
 Certificates   Lease   Total   Lease       Total                   Percentage
 Fiscal Year   of   Revenue   Notes and   Lease   Governmental   Revenue   Notes and   Businesstype  Total Primary   of Personal   Debt per
 Ended June 30   Participation    Bonds     Other     Payables    SBITA Payables    Activities     Bonds     Other     Activities    Government    Income  (1)     Capita
 2016     $  20,000,000   $  33,788,512   $   2,838,000   $   -   $   -   $   56,626,512   $  36,713,979       -  $  36,713,979       93,340,491     2.54%     $   454

 2017         19,391,245       32,324,572       1,800,000       -         -         53,515,817       37,339,941       -     37,339,941       90,855,758     2.41%         439
 2018         18,881,643       31,002,924       1,527,000       -         -         51,411,567       36,185,829       -     36,185,829       87,597,396     2.24%       422

 2019         18,347,041       29,630,276       1,245,000       -         -         49,222,317       50,502,630       8,110,892  (2)     58,613,522    107,835,839     2.64%         518


 2020         17,782,439       28,184,628       954,000       -         -         46,921,067       49,308,523       8,089,757      57,398,280    104,319,347     2.32%         500

 2021         19,830,000       26,682,981       649,000       -         -         47,161,981       48,075,413       7,120,146      55,195,559    102,357,540     2.28%         489
 2022         18,870,000       25,116,334       331,000       2,252,220       -         46,569,554       47,744,600       6,898,177     54,642,777    101,212,331     1.91%         483

 2023         17,905,000       23,473,688       -         1,852,301       1,003,657       44,234,646       46,118,201       6,425,773     52,543,974       96,778,620     1.62%         465

 2024         16,935,000       22,103,883       -         1,447,679       1,115,005       41,601,567       44,518,578       5,936,832     50,455,410       92,056,977     1.65%       444
 2025         15,955,000       20,136,962       -         2,396,730       2,976,329       41,465,021       42,838,426       5,430,777     48,269,203       89,734,224     1.51%         426

 194
 (1)  These ratios are calculated using personal income and population for the prior year.
 (2)  In Fiscal Year 2019 the City and Moreno Valley Utility entered into an Equipment Lease/Purchase Agreement with Bank of America Leasing & Capital for the purchase and retrofit of streetlights.

 Source:  City of Moreno Valley Financial and Management Services Department
    Riverside County Economic Development Agency
    State of California Department of Finance