
Page 224 - Moreno Valley 2025 Annual Financial Report
P. 224
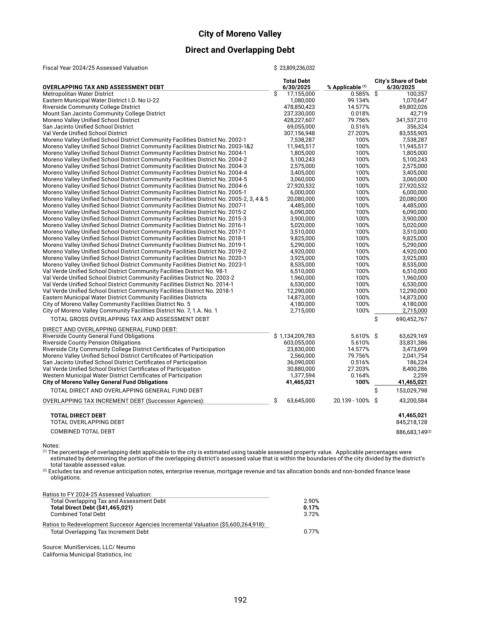
City of Moreno Valley

                                                Direct and Overlapping Debt

            Fiscal Year 2024/25 Assessed Valuation                       $  23,809,236,032

                                                                         Total Debt              City’s Share of Debt
            OVERLAPPING TAX AND ASSESSMENT DEBT                          6/30/2025    % Applicable  (1)     6/30/2025
            Metropolitan Water District                                  $   17,155,000       0.585%   $   100,357
            Eastern Municipal Water District I.D. No U-22                   1,080,000       99.134%      1,070,647
            Riverside Community College District                            478,850,423       14.577%      69,802,026
            Mount San Jacinto Community College District                    237,330,000       0.018%      42,719
            Moreno Valley Unified School District                           428,227,607       79.756%      341,537,210
            San Jacinto Unified School District                             69,055,000       0.516%      356,324
            Val Verde Unified School District                               307,156,948       27.203%      83,555,905
            Moreno Valley Unified School District Community Facilities District No. 2002-1        7,538,287       100%      7,538,287
            Moreno Valley Unified School District Community Facilities District No. 2003-1&2        11,945,517       100%      11,945,517
            Moreno Valley Unified School District Community Facilities District No. 2004-1        1,805,000       100%      1,805,000
            Moreno Valley Unified School District Community Facilities District No. 2004-2        5,100,243       100%      5,100,243
            Moreno Valley Unified School District Community Facilities District No. 2004-3        2,575,000       100%      2,575,000
            Moreno Valley Unified School District Community Facilities District No. 2004-4        3,405,000       100%      3,405,000
            Moreno Valley Unified School District Community Facilities District No. 2004-5        3,060,000       100%      3,060,000
            Moreno Valley Unified School District Community Facilities District No. 2004-6        27,920,532       100%      27,920,532
            Moreno Valley Unified School District Community Facilities District No. 2005-1        6,000,000       100%      6,000,000
            Moreno Valley Unified School District Community Facilities District No. 2005-2, 3, 4 & 5      20,080,000       100%      20,080,000
            Moreno Valley Unified School District Community Facilities District No. 2007-1        4,485,000       100%      4,485,000
            Moreno Valley Unified School District Community Facilities District No. 2015-2        6,090,000       100%      6,090,000
            Moreno Valley Unified School District Community Facilities District No. 2015-3        3,900,000       100%      3,900,000
            Moreno Valley Unified School District Community Facilities District No. 2016-1        5,020,000       100%      5,020,000
            Moreno Valley Unified School District Community Facilities District No. 2017-1        3,510,000       100%      3,510,000
            Moreno Valley Unified School District Community Facilities District No. 2018-1        9,825,000       100%      9,825,000
            Moreno Valley Unified School District Community Facilities District No. 2019-1        5,290,000       100%      5,290,000
            Moreno Valley Unified School District Community Facilities District No. 2019-2        4,920,000       100%      4,920,000
            Moreno Valley Unified School District Community Facilities District No. 2020-1        3,925,000       100%      3,925,000
            Moreno Valley Unified School District Community Facilities District No. 2023-1        8,535,000       100%      8,535,000
            Val Verde Unified School District Community Facilities District No. 98-1        6,510,000       100%      6,510,000
            Val Verde Unified School District Community Facilities District No. 2003-2        1,960,000       100%      1,960,000
            Val Verde Unified School District Community Facilities District No. 2014-1        6,530,000       100%      6,530,000
            Val Verde Unified School District Community Facilities District No. 2018-1        12,290,000       100%      12,290,000
            Eastern Municipal Water District Community Facilities Districts        14,873,000       100%      14,873,000
            City of Moreno Valley Community Facilities District No. 5        4,180,000       100%       4,180,000
            City of Moreno Valley Community Facilities District No. 7, 1.A. No. 1        2,715,000       100%      2,715,000
              TOTAL GROSS OVERLAPPING TAX AND ASSESSMENT DEBT                                     $   690,452,767
            DIRECT AND OVERLAPPING GENERAL FUND DEBT:
            Riverside County General Fund Obligations                    $  1,134,209,783       5.610%   $   63,629,169
            Riverside County Pension Obligations                            603,055,000       5.610%      33,831,386
            Riverside City Community College District Certificates of Participation        23,830,000       14.577%      3,473,699
            Moreno Valley Unified School District Certificates of Participation        2,560,000       79.756%      2,041,754
            San Jacinto Unified School District Certificates of Participation        36,090,000       0.516%      186,224
            Val Verde Unified School District Certificates of Participation        30,880,000       27.203%      8,400,286
            Western Municipal Water District Certificates of Participation        1,377,594       0.164%      2,259
            City of Moreno Valley General Fund Obligations                 41,465,021       100%       41,465,021
              TOTAL DIRECT AND OVERLAPPING GENERAL FUND DEBT                                      $   153,029,798
            OVERLAPPING TAX INCREMENT DEBT (Successor Agencies):          $   63,645,000       20.139 - 100%   $   43,200,584

              TOTAL DIRECT DEBT                                                                        41,465,021
              TOTAL OVERLAPPING DEBT                                                                  845,218,128
              COMBINED TOTAL DEBT                                                                     886,683,149 (2)

            Notes:
            (1)  The percentage of overlapping debt applicable to the city is estimated using taxable assessed property value.  Applicable percentages were
              estimated by determining the portion of the overlapping district’s assessed value that is within the boundaries of the city divided by the district’s
              total taxable assessed value.
            (2)  Excludes tax and revenue anticipation notes, enterprise revenue, mortgage revenue and tax allocation bonds and non-bonded finance lease
              obligations.

            Ratios to FY 2024-25 Assessed Valuation:
              Total Overlapping Tax and Assessment Debt                        2.90%
              Total Direct Debt ($41,465,021)                                 0.17%
              Combined Total Debt                                              3.72%
            Ratios to Redevelopment Succesor Agencies Incremental Valuation ($5,600,264,918):
              Total Overlapping Tax Increment Debt                             0.77%

            Source: MuniServices, LLC/ Neumo
            California Municipal Statistics, Inc


                                                             192