
Page 221 - Moreno Valley 2025 Annual Financial Report
P. 221
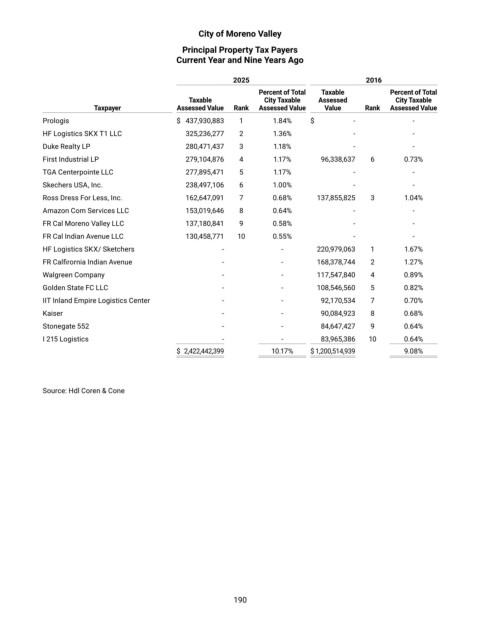
City of Moreno Valley

                                               Principal Property Tax Payers
                                              Current Year and Nine Years Ago


                                                            2025                              2016
                                                                   Percent of Total   Taxable        Percent of Total
                                                 Taxable            City Taxable   Assessed           City Taxable
                         Taxpayer              Assessed Value   Rank   Assessed Value   Value     Rank   Assessed Value
            Prologis                           $  437,930,883   1      1.84%     $         -              -
            HF Logistics SKX T1 LLC               325,236,277   2      1.36%               -              -
            Duke Realty LP                        280,471,437   3      1.18%               -              -
            First Industrial LP                   279,104,876   4      1.17%        96,338,637   6      0.73%

            TGA Centerpointe LLC                  277,895,471   5      1.17%               -              -
            Skechers USA, Inc.                    238,497,106   6      1.00%               -              -
            Ross Dress For Less, Inc.             162,647,091   7      0.68%       137,855,825   3      1.04%
            Amazon Com Services LLC               153,019,646   8      0.64%               -              -
            FR Cal Moreno Valley LLC              137,180,841   9      0.58%               -              -
            FR Cal Indian Avenue LLC              130,458,771   10     0.55%               -              -
            HF Logistics SKX/ Sketchers                   -              -         220,979,063   1      1.67%
            FR Calfirornia Indian Avenue                  -              -         168,378,744   2      1.27%
            Walgreen Company                              -              -         117,547,840   4      0.89%
            Golden State FC LLC                           -              -         108,546,560   5      0.82%
            IIT Inland Empire Logistics Center            -              -          92,170,534   7      0.70%
            Kaiser                                        -              -          90,084,923   8      0.68%
            Stonegate 552                                 -              -          84,647,427   9      0.64%
            I 215 Logistics                               -              -          83,965,386   10     0.64%
                                               $  2,422,442,399        10.17%    $ 1,200,514,939        9.08%


            Source: Hdl Coren & Cone


                                                             190