
Page 217 - Moreno Valley 2025 Annual Financial Report
P. 217
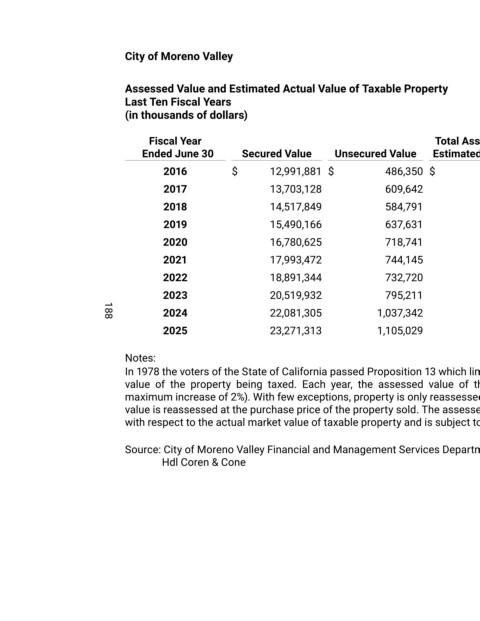
City of Moreno Valley


                                 Assessed Value and Estimated Actual Value of Taxable Property
                                 Last Ten Fiscal Years
                                 (in thousands of dollars)


                                       Fiscal Year                                                              Total Assessed and                                     Taxable Assessed
                                      Ended June 30            Secured Value   Unsecured Value   Estimated Full Value                        Less: Exemptions                  Value             Direct Tax Rate

                                           2016               $       12,991,881   $               486,350   $              13,478,231   $               (256,756)   $           13,221,475                 0.00173

                                           2017                       13,703,128                   609,642                  14,312,770                   (265,286)               14,047,484                 0.00172

                                           2018                       14,517,849                   584,791                  15,102,640                   (273,025)               14,829,615                 0.00169
                                           2019                       15,490,166                   637,631                  16,127,797                   (360,916)               15,766,881                 0.00166

                                           2020                       16,780,625                   718,741                  17,499,366                   (494,977)               17,004,389                 0.00162

                                           2021                       17,993,472                   744,145                  18,737,617                   (525,363)               18,212,254                 0.00155

                                           2022                       18,891,344                   732,720                  19,624,064                   (416,160)               19,207,904                 0.00152

                                           2023                       20,519,932                   795,211                  21,315,143                   (433,258)               20,881,885                 0.00153

                                           2024                       22,081,305                 1,037,342                  23,118,647                   (446,203)               22,672,444                 0.00156
                            188
                                           2025                       23,271,313                 1,105,029                  24,376,342                   (545,345)               23,830,997                 0.00160

                                 Notes:
                                 In 1978 the voters of the State of California passed Proposition 13 which limited property taxes to a maximum rate of 1% based upon the assessed
                                 value  of  the  property  being  taxed.  Each  year,  the  assessed  value  of  the  property  may  be  increased  by  an  “inflation  factor” (limited to a
                                 maximum increase of 2%). With few exceptions, property is only reassessed at the time that it is sold to a new owner. At that point, the new assessed
                                 value is reassessed at the purchase price of the property sold. The assessed valuation data shown above represents the only data currently available
                                 with respect to the actual market value of taxable property and is subject to the limitations described above.

                                 Source: City of Moreno Valley Financial and Management Services Department
                                               Hdl Coren & Cone