
Page 214 - Moreno Valley 2025 Annual Financial Report
P. 214
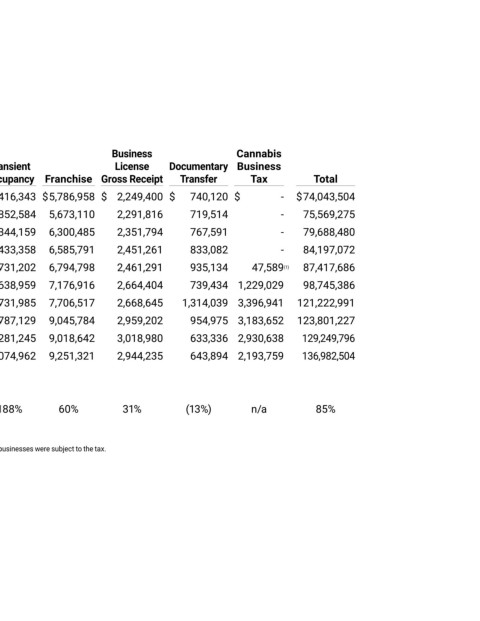
City of Moreno Valley


 Tax Revenues by Source, General Fund
 Last Ten Fiscal Years
 (modified accrual basis of accounting)


 Property Tax
 In-Lieu of                  Business                        Cannabis
 Vehicle License   Transient   License      Documentary  Business
 Fiscal Year    Property    Fees    Utility Users   Sales    Occupancy   Franchise   Gross Receipt   Transfer     Tax     Total

 2016     $ 12,679,455   $   16,409,009   $ 15,824,481   $ 18,937,738   $ 1,416,343   $ 5,786,958   $  2,249,400   $   740,120   $   -   $ 74,043,504

 2017       13,593,075      17,430,250     15,613,484     18,395,442     1,852,584     5,673,110      2,291,816      719,514       -       75,569,275

 2018       14,696,576      18,406,258     15,629,102     19,192,515     2,344,159     6,300,485      2,351,794      767,591       -       79,688,480

 2019       15,623,696      19,577,636     15,483,806     21,208,442     2,433,358     6,585,791      2,451,261      833,082       -       84,197,072
 2020       17,217,684      21,232,068     15,499,534     20,498,386     2,731,202     6,794,798      2,461,291      935,134      47,589 (1)    87,417,686

 2021       18,473,330      22,738,372     16,361,233     25,723,709     3,638,959     7,176,916      2,664,404      739,434    1,229,029     98,745,386

 2022       19,290,569      23,835,902     17,708,256     40,570,137     4,731,985     7,706,517      2,668,645     1,314,039    3,396,941    121,222,991

 2023       21,268,854      25,938,708     19,501,114     36,161,809     4,787,129     9,045,784      2,959,202      954,975    3,183,652    123,801,227
 186

 2024       23,928,256      28,131,102     19,496,246     37,811,351     4,281,245     9,018,642      3,018,980      633,336    2,930,638    129,249,796
 2025       25,592,633      29,543,294     21,582,335     41,156,071     4,074,962     9,251,321      2,944,235      643,894    2,193,759    136,982,504


 Change

 2016 to 2025  102%     80%     36%     117%     188%     60%     31%       (13%)     n/a       85%

 Notes:

 (1)  In Fiscal Year 2018-19 the voters approved the Cannabis Business Tax.  Fiscal Year 2019-20 was the first year any businesses were subject to the tax.


 Source: City of Moreno Valley Financial and Management Services Department