
Page 216 - Moreno Valley 2025 Annual Financial Report
P. 216
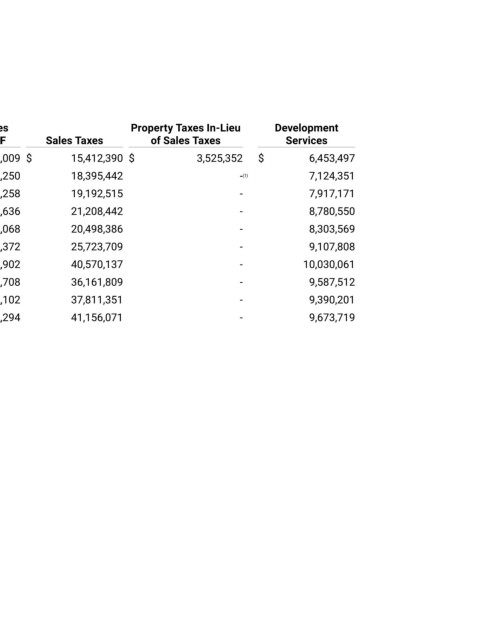
City of Moreno Valley


 Key Revenues, General Fund
 Last Ten Fiscal Years


 Utility Users   Property Taxes   Property Taxes In-Lieu               Development
 Fiscal Year    Taxes     Property Taxes     In-Lieu of VLF     Sales Taxes     of Sales Taxes     Services

 2016     $   15,824,481   $   12,679,455   $   16,409,009   $   15,412,390   $   3,525,352  $   6,453,497

 2017         15,613,484       13,593,075       17,430,250       18,395,442       -  (1)     7,124,351

 2018         15,629,102       14,696,576       18,406,258       19,192,515       -     7,917,171
 2019         15,483,806       15,623,696       19,577,636       21,208,442       -     8,780,550

 2020         15,499,534       17,217,684       21,232,068       20,498,386       -     8,303,569

 2021         16,361,233       18,473,330       22,738,372       25,723,709       -     9,107,808

 2022         17,708,256       19,290,569       23,835,902       40,570,137       -     10,030,061

 2023         19,501,114       21,268,854       25,938,708       36,161,809       -     9,587,512

 2024         19,496,246       23,928,256       28,131,102       37,811,351       -     9,390,201
 2025         21,582,335       25,592,633       29,543,294       41,156,071       -     9,673,719
 187

 Notes:
 (1)  Per direction of the State Director of Finance, the Triple Flip program ended in 2016.

 Source: City of Moreno Valley Financial and Management Services Department