
Page 211 - Moreno Valley 2025 Annual Financial Report
P. 211
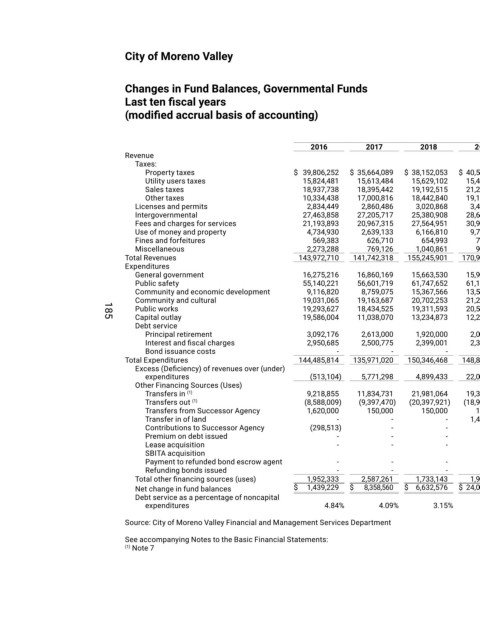
City of Moreno Valley
Changes in Fund Balances, Governmental Funds
Last ten fiscal years
(modified accrual basis of accounting)
Fiscal Year
2016 2017 2018 2019 2020 2021 2022 2023 2024 2025
Revenue
Taxes:
Property taxes $ 39,806,252 $ 35,664,089 $ 38,152,053 $ 40,517,556 $ 44,284,961 $ 47,480,138 $ 49,694,895 $ 54,491,764 $ 59,981,500 $ 63,344,023
Utility users taxes 15,824,481 15,613,484 15,629,102 15,483,806 15,499,534 16,361,233 17,708,256 19,501,114 19,496,246 21,582,335
Sales taxes 18,937,738 18,395,442 19,192,515 21,208,442 20,498,386 25,723,709 40,570,137 36,161,809 37,811,351 41,156,071
Other taxes 10,334,438 17,000,816 18,442,840 19,195,836 19,910,694 22,470,294 27,251,443 28,589,825 27,956,622 28,064,878
Licenses and permits 2,834,449 2,860,486 3,020,868 3,468,511 3,843,038 4,193,378 4,182,232 4,254,783 4,874,730 5,222,471
Intergovernmental 27,463,858 27,205,717 25,380,908 28,676,795 33,520,861 40,157,921 79,949,940 72,421,769 57,258,861 43,030,992
Fees and charges for services 21,193,893 20,967,315 27,564,951 30,913,729 24,349,889 29,879,326 28,693,598 40,149,340 41,710,252 37,646,258
Use of money and property 4,734,930 2,639,133 6,166,810 9,724,871 12,006,098 2,306,145 (7,101,511) 7,298,241 19,950,224 23,070,955
Fines and forfeitures 569,383 626,710 654,993 756,901 583,471 765,724 664,744 681,815 513,289 353,339
Miscellaneous 2,273,288 769,126 1,040,861 999,027 1,090,864 1,872,604 1,248,875 10,822,816 3,139,729 2,346,108
Total Revenues 143,972,710 141,742,318 155,245,901 170,945,474 175,587,796 191,210,472 242,862,609 274,373,276 272,692,804 265,817,430
Expenditures
General government 16,275,216 16,860,169 15,663,530 15,912,863 18,917,838 19,799,613 32,927,152 22,235,810 27,425,597 34,707,729
Public safety 55,140,221 56,601,719 61,747,652 61,141,018 64,599,689 64,345,030 67,264,088 74,925,997 81,333,402 86,418,992
Community and economic development 9,116,820 8,759,075 15,367,566 13,531,870 14,336,632 16,522,665 18,006,440 15,718,315 18,871,678 21,773,018
Community and cultural 19,031,065 19,163,687 20,702,253 21,241,618 22,215,275 23,131,291 25,003,971 26,110,860 28,821,492 31,619,921
Public works 19,293,627 18,434,525 19,311,593 20,516,249 21,395,223 20,209,010 22,753,740 24,203,895 27,299,933 29,498,394
Capital outlay 19,586,004 11,038,070 13,234,873 12,203,689 18,680,033 20,407,331 19,082,597 82,700,583 40,137,035 46,009,049
185
Debt service
Principal retirement 3,092,176 2,613,000 1,920,000 2,005,000 2,117,000 2,757,000 3,061,950 3,844,680 3,480,254 24,989,755
Interest and fiscal charges 2,950,685 2,500,775 2,399,001 2,304,456 2,205,181 1,501,066 1,617,657 1,587,143 1,596,492 1,687,649
Bond issuance costs - - - - - 381,094 - - - -
Total Expenditures 144,485,814 135,971,020 150,346,468 148,856,763 164,466,871 169,054,100 189,717,595 251,327,283 228,965,883 276,704,507
Excess (Deficiency) of revenues over (under)
expenditures (513,104) 5,771,298 4,899,433 22,088,711 11,120,925 22,156,372 53,145,014 23,045,993 43,726,921 (10,887,077)
Other Financing Sources (Uses)
Transfers in (1) 9,218,855 11,834,731 21,981,064 19,333,554 19,029,915 32,697,172 39,319,526 49,392,796 29,560,598 71,534,766
Transfers out (1) (8,588,009) (9,397,470) (20,397,921) (18,964,541) (22,462,686) (35,957,806) (51,741,289) (71,954,569) (52,373,896) (83,657,228)
Transfers from Successor Agency 1,620,000 150,000 150,000 150,000 150,000 150,000 150,000 150,000 - -
Transfer in of land - - - 1,474,226 - - - - - -
Contributions to Successor Agency (298,513) - - - - - - - - -
Premium on debt issued - - - - - - - - - 2,262,806
Lease acquisition - - - - - - 2,659,170 - - 1,415,127
SBITA acquisition 1,802,782 919,810 446,070
Payment to refunded bond escrow agent - - - - - (20,382,555) - - - -
Refunding bonds issued - - - - - 20,970,000 - - - 19,645,416
Total other financing sources (uses) 1,952,333 2,587,261 1,733,143 1,993,239 (3,282,771) (2,523,189) (9,612,593) (20,608,991) (21,893,488) 11,646,957
Net change in fund balances $ 1,439,229 $ 8,358,560 $ 6,632,576 $ 24,081,950 $ 7,838,154 $ 19,633,183 $ 43,532,421 $ 2,437,002 $ 21,833,433 $ 759,880
Debt service as a percentage of noncapital
expenditures 4.84% 4.09% 3.15% 3.15% 2.96% 3.12% 2.74% 3.22% 2.91% 11.45%
Source: City of Moreno Valley Financial and Management Services Department
See accompanying Notes to the Basic Financial Statements:
(1) Note 7