
Page 208 - Moreno Valley 2025 Annual Financial Report
P. 208
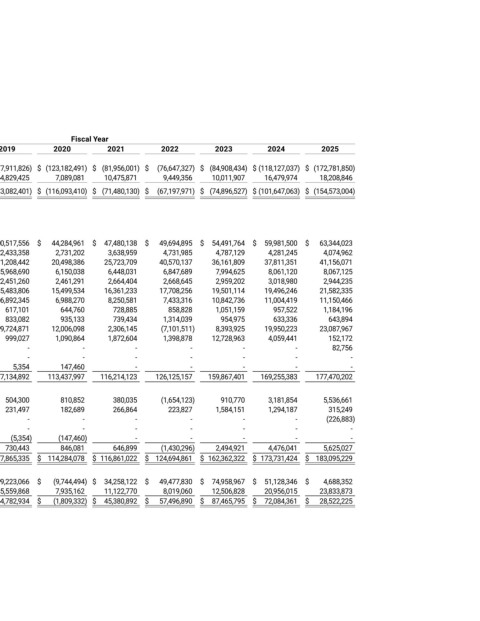
City of Moreno Valley


 Change in Net Position
 Last ten fiscal years
 (accrual basis of accounting)


                   Fiscal Year
       2016     2017     2018     2019     2020     2021     2022     2023     2024     2025
 Net (Expense)/Revenue
 Governmental activities    $  (75,981,553)   $ (104,344,453)   $ (112,119,812)   $  (97,911,826)   $  (123,182,491)   $  (81,956,001)   $  (76,647,327)   $  (84,908,434)   $ (118,127,037)   $  (172,781,850)
 Business-type activities       5,133,504        3,771,183        5,156,466        4,829,425        7,089,081        10,475,871        9,449,356        10,011,907        16,479,974        18,208,846
 Total primary government net (expense)/revenue    $  (70,848,049)    $ (100,573,270)    $ (106,963,346)    $  (93,082,401)    $  (116,093,410)    $  (71,480,130)    $  (67,197,971)    $  (74,896,527)    $ (101,647,063)    $  (154,573,004)
 General Revenues and Other Changes in Net
 Position
 Governmental activities:
 Taxes:
 Property taxes    $  33,418,804    $  35,664,089    $  38,152,053    $   40,517,556    $   44,284,961    $  47,480,138    $   49,694,895    $  54,491,764    $  59,981,500    $   63,344,023
 Transient occupancy taxes       1,416,343        1,852,584        2,344,159        2,433,358        2,731,202        3,638,959        4,731,985        4,787,129        4,281,245        4,074,962
 Sales taxes       18,937,738        18,395,442        19,192,515        21,208,442        20,498,386        25,723,709        40,570,137        36,161,809        37,811,351        41,156,071
 Franchise taxes       5,493,936        5,384,726        5,680,137        5,968,690        6,150,038        6,448,031        6,847,689        7,994,625        8,061,120        8,067,125
 Business license taxes       2,249,400        2,291,816        2,351,794        2,451,260        2,461,291        2,664,404        2,668,645        2,959,202        3,018,980        2,944,235
 Utility users taxes       15,824,481        15,613,484        15,629,102        15,483,806        15,499,534        16,361,233        17,708,256        19,501,114        19,496,246        21,582,335
 Other taxes       6,529,065        6,464,018        6,678,812        6,892,345        6,988,270        8,250,581        7,433,316        10,842,736        11,004,419        11,150,466
 Franchise in lieu taxes       293,022        288,383        620,349        617,101        644,760        728,885        858,828        1,051,159        957,522        1,184,196
 Documentary transfer tax       740,120        719,514        767,591        833,082        935,133        739,434        1,314,039        954,975        633,336        643,894
 183
 Use of money and property       4,774,277        2,639,133        6,166,810        9,724,871        12,006,098        2,306,145        (7,101,511)       8,393,925        19,950,223        23,087,967
 Miscellaneous       1,975,035        769,125        1,040,861        999,027        1,090,864        1,872,604        1,398,878        12,728,963        4,059,441        152,172
 Gain (Loss) on disposal of capital assets       -         -         -         -         -         -         -         -         -         82,756
 Contributed capital       -         -         14,513,139        -         -         -         -         -         -         -
 Transfers       -         -         300,000        5,354        147,460        -         -         -         -         -
 Total governmental activities       91,652,221        90,082,314       113,437,322        107,134,892        113,437,997       116,214,123        126,125,157       159,867,401       169,255,383        177,470,202
 Business-type activities
 Use of property and money       202,544        129,253        47,572        504,300        810,852        380,035        (1,654,123)       910,770        3,181,854        5,536,661
 Miscellaneous       2,124,605        209,279        293,756        231,497        182,689        266,864        223,827        1,584,151        1,294,187        315,249
 Gain (Loss) on disposal of capital assets       -         -         -         -         -         -         -         -         -         (226,883)
 Contributed capital       -         -         3,098,784        -         -         -         -         -         -         -
 Transfers       -         -         (300,000)       (5,354)       (147,460)       -         -         -         -         -
 Total business-type activities       2,327,149        338,532        3,140,112        730,443        846,081        646,899        (1,430,296)       2,494,921        4,476,041        5,625,027
 Total primary government    $  93,979,370     $  90,420,846     $  116,577,434     $  107,865,335     $  114,284,078     $  116,861,022     $  124,694,861     $  162,362,322     $  173,731,424     $  183,095,229
 Change in Net Position
 Government activities    $  15,670,668    $  (14,262,139)   $   1,317,510    $   9,223,066    $   (9,744,494)   $  34,258,122    $   49,477,830    $  74,958,967    $  51,128,346    $   4,688,352
 Business-type activities       7,460,653        4,109,715        8,296,578        5,559,868        7,935,162        11,122,770        8,019,060        12,506,828        20,956,015        23,833,873
 Total primary government    $  23,131,321     $  (10,152,424)    $   9,614,088     $   14,782,934     $   (1,809,332)    $  45,380,892     $   57,496,890     $  87,465,795     $  72,084,361     $   28,522,225

 Source: City of Moreno Valley Financial and Management Services Department