
Page 203 - Moreno Valley 2025 Annual Financial Report
P. 203
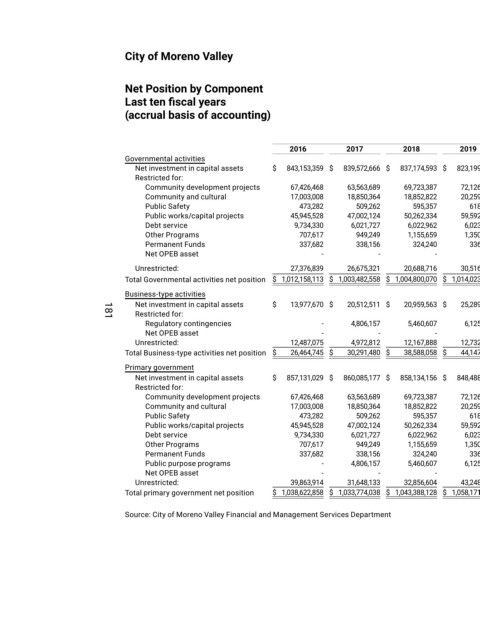
City of Moreno Valley


                                 Net Position by Component
                                 Last ten fiscal years
                                 (accrual basis of accounting)


                                                                                                                                         Fiscal Year
                                                                           2016          2017           2018          2019           2020          2021           2022          2023           2024          2025
                                 Governmental activities
                                   Net investment in capital assets    $   843,153,359   $   839,572,666   $   837,174,593   $   823,199,477   $   807,820,542   $   815,230,770   $   790,714,054   $   856,489,261   $   877,152,233   $   877,124,028
                                   Restricted for:
                                      Community development projects       67,426,468       63,563,689       69,723,387       72,126,493       71,043,104       76,026,632      45,190,864      46,500,366      45,227,393      46,277,224
                                      Community and cultural               17,003,008       18,850,364       18,852,822       20,259,407       21,850,049       22,426,157      23,276,291      30,105,216      764,243      1,016,898
                                      Public Safety                          473,282        509,262       595,357        618,440       583,248        583,248       422,503        604,679      23,428,211      19,846,381
                                      Public works/capital projects        45,945,528       47,002,124       50,262,334       59,592,469       59,630,024       63,605,906      87,504,537      6,029,354      110,536,171      103,371,277
                                      Debt service                          9,734,330       6,021,727       6,022,962       6,023,401       6,021,207       6,224,295      6,021,107      6,021,107      5,988,930      6,038,300
                                      Other Programs                         707,617        949,249       1,155,659       1,350,421       1,411,128       1,608,165      1,884,724      2,475,298      65,441      82,251
                                      Permanent Funds                        337,682        338,156       324,240        336,843       345,754        346,215        44,353         51,578      2,785,056      2,738,778
                                      Net OPEB asset                               -              -             -              -             -              -             -              -             -        812,256
                                   Unrestricted:                           27,376,839       26,675,321       20,688,716       30,516,185       35,538,041       52,708,448      133,179,233      139,483,474      148,377,302      161,705,939
                                 Total Governmental activities net position   $  1,012,158,113    $  1,003,482,558    $  1,004,800,070    $  1,014,023,136    $  1,004,278,642    $  1,038,759,836    $  1,088,237,666    $  1,081,739,227    $  1,214,324,980    $  1,219,013,332
                                 Business-type activities
                                   Net investment in capital assets    $   13,977,670   $   20,512,511   $   20,959,563   $   25,289,496   $   25,754,111   $   29,351,232   $   27,055,337   $   30,453,356   $   36,479,881   $   37,896,263
                                   Restricted for:
                                      Regulatory contingencies                     -         4,806,157       5,460,607       6,125,796       5,048,552       6,069,655      7,939,389      10,225,486      12,051,980      14,338,812
                            181
                                      Net OPEB asset                               -              -             -              -             -              -             -              -             -         41,044
                                   Unrestricted:                           12,487,075       4,972,812       12,167,888       12,732,634       21,280,425       27,784,971      36,230,192      43,052,904      56,155,900      76,245,515
                                 Total Business-type activities net position  $   26,464,745    $   30,291,480    $   38,588,058    $   44,147,926    $   52,083,088    $   63,205,858    $   71,224,918    $   83,731,746    $   104,687,761    $   128,521,634

                                 Primary government
                                   Net investment in capital assets    $   857,131,029   $   860,085,177   $   858,134,156   $   848,488,973   $   833,574,653   $   844,582,002   $   817,769,391   $   886,942,617   $   913,632,114   $   915,020,291
                                   Restricted for:
                                      Community development projects       67,426,468       63,563,689       69,723,387       72,126,493       71,043,104       76,026,632      45,190,864      46,500,366      45,227,393      46,277,224
                                      Community and cultural               17,003,008       18,850,364       18,852,822       20,259,407       21,850,049       22,426,157      23,276,291      30,105,216      764,243      1,016,898
                                      Public Safety                          473,282        509,262       595,357        618,440       618,793        583,248       422,503        604,679      23,428,211      19,846,381
                                      Public works/capital projects        45,945,528       47,002,124       50,262,334       59,592,469       59,630,024       63,605,906      87,504,537      81,457,406      110,536,171      103,371,277
                                      Debt service                          9,734,330       6,021,727       6,022,962       6,023,401       6,021,207       6,224,295      6,021,107      6,029,355      5,988,930      6,038,300
                                      Other Programs                         707,617        949,249       1,155,659       1,350,421       1,411,128       1,608,165      1,884,724      2,475,298      65,441      82,251
                                      Permanent Funds                        337,682        338,156       324,240        336,843       345,754        346,215        44,353         51,578      2,785,056      2,738,778
                                      Public purpose programs                      -         4,806,157       5,460,607       6,125,796       5,048,552       6,069,655      7,939,389      10,225,486      12,051,980      14,338,812
                                      Net OPEB asset                               -              -             -              -             -              -             -              -             -        853,300
                                   Unrestricted:                           39,863,914       31,648,133       32,856,604       43,248,819       56,818,466       80,493,419      169,409,425      182,536,378      204,533,202      237,951,454
                                 Total primary government net position    $  1,038,622,858    $  1,033,774,038    $  1,043,388,128    $  1,058,171,062    $  1,056,361,730    $  1,101,965,694    $  1,159,462,584    $  1,246,928,379    $  1,319,012,741    $  1,347,534,966

                                 Source: City of Moreno Valley Financial and Management Services Department