
Page 206 - Moreno Valley 2025 Annual Financial Report
P. 206
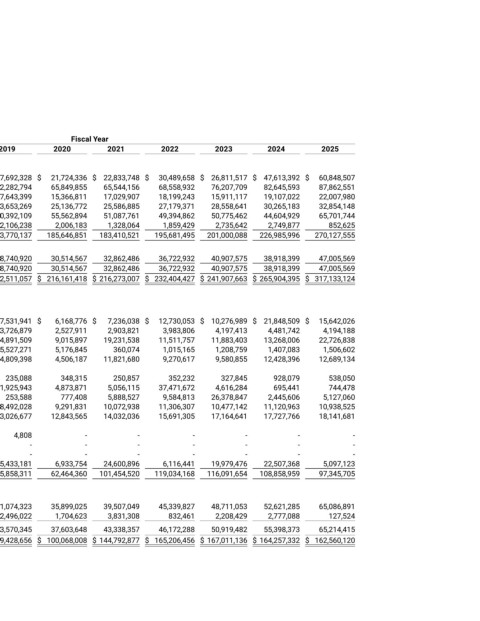
City of Moreno Valley


 Change in Net Position
 Last ten fiscal years
 (accrual basis of accounting)


                   Fiscal Year
       2016     2017     2018     2019     2020     2021     2022     2023     2024     2025
 Expenses
 Governmental activities:
 General government    $  17,250,813   $  20,743,087   $  17,866,194   $   17,692,328   $   21,724,336   $  22,833,748   $   30,489,658   $  26,811,517   $  47,613,392   $   60,848,507
 Public safety       56,238,838      57,880,925      62,932,166      62,282,794      65,849,855      65,544,156      68,558,932      76,207,709      82,645,593      87,862,551
 Community and economic development       9,228,108      9,895,574      16,127,907      17,643,399      15,366,811      17,029,907      18,199,243      15,911,117      19,107,022      22,007,980
 Community and cultural       20,910,986      22,144,633      23,158,730      23,653,269      25,136,772      25,586,885      27,179,371      28,558,641      30,265,183      32,854,148
 Public works       34,772,136      39,433,172      47,833,852      50,392,109      55,562,894      51,087,761      49,394,862      50,775,462      44,604,929      65,701,744
 Interest       3,625,888      2,407,992      2,201,392      2,106,238      2,006,183      1,328,064      1,859,429      2,735,642      2,749,877      852,625
 Total Governmental activities expenses      142,026,769      152,505,383      170,120,241       173,770,137       185,646,851      183,410,521       195,681,495      201,000,088      226,985,996       270,127,555
 Business-type activities
 Electric       24,230,159      25,319,390      26,286,674      28,740,920      30,514,567      32,862,486      36,722,932      40,907,575      38,918,399      47,005,569
 Total business-type activities expenses       24,230,159       25,319,390       26,286,674       28,740,920       30,514,567       32,862,486       36,722,932       40,907,575       38,918,399       47,005,569
 Total primary government expenses    $ 166,256,928    $ 177,824,773    $ 196,406,915    $  202,511,057    $  216,161,418    $ 216,273,007    $  232,404,427    $ 241,907,663    $ 265,904,395    $  317,133,124
 Program revenues
 Governmental activities:
 Charges for services:
 General government    $   6,142,310   $   6,705,689   $   7,862,247   $   7,531,941   $   6,168,776   $   7,236,038   $   12,730,053   $  10,276,989   $  21,848,509   $   15,642,026
 182
 Public safety       3,409,176      3,013,430      3,797,064      3,726,879      2,527,911      2,903,821      3,983,806      4,197,413      4,481,742      4,194,188
 Community and economic development       7,437,687      3,710,803      10,912,039      14,891,509      9,015,897      19,231,538      11,511,757      11,883,403      13,268,006      22,726,838
 Community and cultural       4,927,785      5,992,611      5,947,505      5,527,271      5,176,845      360,074      1,015,165      1,208,759      1,407,083      1,506,602
 Public works       3,268,761      3,765,362      6,547,035      4,809,398      4,506,187      11,821,680      9,270,617      9,580,855      12,428,396      12,689,134
 Operating contributions and grants:
 General government       121,850      146,906      325,286      235,088      348,315      250,857      352,232      327,845      928,079      538,050
 Public safety       3,954,561      2,459,630      2,896,580      1,925,943      4,873,871      5,056,115      37,471,672      4,616,284      695,441      744,478
 Community and economic development       1,225,925      120,222      363,296      253,588      777,408      5,888,527      9,584,813      26,378,847      2,445,606      5,127,060
 Community and cultural       7,437,170      7,306,606      8,329,978      8,492,028      9,291,831      10,072,938      11,306,307      10,477,142      11,120,963      10,938,525
 Public works       10,131,877      9,395,207      9,940,429      13,026,677      12,843,565      14,032,036      15,691,305      17,164,641      17,727,766      18,141,681
 Capital grants and contributions
 General government       -         -         -        4,808       -         -         -         -         -         -
 Community and economic development       16,349,211       -         -         -         -         -         -         -         -         -
 Community and cultural       -         -        431,335       -         -         -         -         -         -         -
 Public works       1,638,903      5,544,464      647,635      15,433,181      6,933,754      24,600,896      6,116,441      19,979,476      22,507,368      5,097,123
 Total governmental activities program revenues       66,045,216       48,160,930       58,000,429       75,858,311       62,464,360      101,454,520       119,034,168      116,091,654      108,858,959       97,345,705
 Business-type activities:
 Charges for services:
 Electric       29,363,663      29,090,573      31,443,140      31,074,323      35,899,025      39,507,049      45,339,827      48,711,053      52,621,285      65,086,891
 Operating/Capital grants and contributions       -         -         -        2,496,022      1,704,623      3,831,308      832,461      2,208,429      2,777,088      127,524
 Total business-type activities program revenues      29,363,663      29,090,573      31,443,140      33,570,345      37,603,648      43,338,357      46,172,288      50,919,482      55,398,373      65,214,415
 Total primary government program revenues    $  95,408,879    $  77,251,503    $  89,443,569    $  109,428,656    $  100,068,008    $ 144,792,877    $  165,206,456    $ 167,011,136    $ 164,257,332    $  162,560,120
 Source: City of Moreno Valley Financial and Management Services Department