Page 51 - Moreno Valley 2025 Annual Financial Report
P. 51

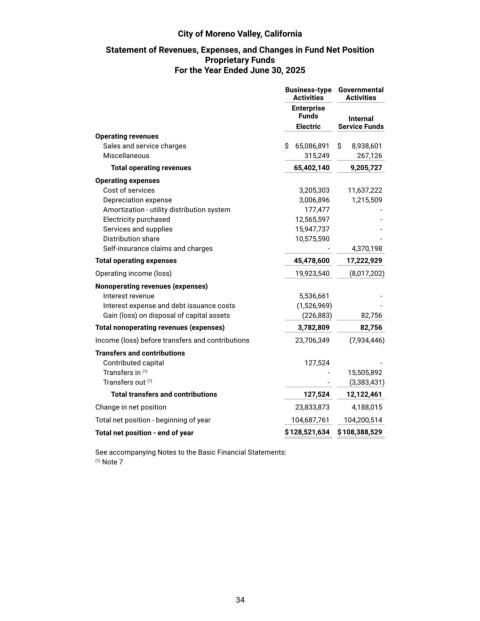
City of Moreno Valley, California

                            Statement of Revenues, Expenses, and Changes in Fund Net Position
                                                     Proprietary Funds
                                              For the Year Ended June 30, 2025


                                                                          Business-type  Governmental
                                                                            Activities     Activities
                                                                           Enterprise
                                                                             Funds        Internal
                                                                             Electric     Service Funds
                         Operating revenues
                           Sales and service charges                      $  65,086,891    $   8,938,601
                           Miscellaneous                                       315,249        267,126
                             Total operating revenues                       65,402,140      9,205,727
                         Operating expenses
                           Cost of services                                  3,205,303        11,637,222
                           Depreciation expense                              3,006,896        1,215,509
                           Amortization ‐ utility distribution system          177,477            -
                           Electricity purchased                             12,565,597           -
                           Services and supplies                             15,947,737           -
                           Distribution share                                10,575,590           -
                           Self‐insurance claims and charges                         -         4,370,198
                         Total operating expenses                           45,478,600      17,222,929
                         Operating income (loss)                             19,923,540        (8,017,202)
                         Nonoperating revenues (expenses)
                           Interest revenue                                  5,536,661            -
                           Interest expense and debt issuance costs          (1,526,969)          -
                           Gain (loss) on disposal of capital assets          (226,883)       82,756
                         Total nonoperating revenues (expenses)              3,782,809       82,756

                         Income (loss) before transfers and contributions       23,706,349        (7,934,446)
                         Transfers and contributions
                           Contributed capital                                 127,524            -
                           Transfers in  (1)                                         -         15,505,892
                           Transfers out  (1)                                        -         (3,383,431)
                             Total transfers and contributions                127,524      12,122,461
                         Change in net position                              23,833,873        4,188,015
                         Total net position - beginning of year             104,687,761     104,200,514

                         Total net position - end of year                 $ 128,521,634     $ 108,388,529

                         See accompanying Notes to the Basic Financial Statements:
                         (1)  Note 7


                                                             34
   46   47   48   49   50   51   52   53   54   55   56