
Page 76 - Moreno Valley 2025 Annual Financial Report
P. 76
City of Moreno Valley, California
Notes to Financial Statements
For the Year Ended June 30, 2025
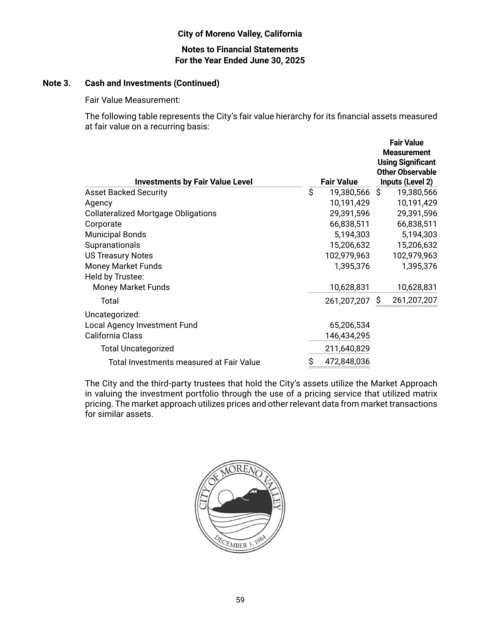
Note 3. Cash and Investments (Continued)
Fair Value Measurement:
The following table represents the City’s fair value hierarchy for its financial assets measured
at fair value on a recurring basis:
Fair Value
Measurement
Using Significant
Other Observable
Investments by Fair Value Level Fair Value Inputs (Level 2)
Asset Backed Security $ 19,380,566 $ 19,380,566
Agency 10,191,429 10,191,429
Collateralized Mortgage Obligations 29,391,596 29,391,596
Corporate 66,838,511 66,838,511
Municipal Bonds 5,194,303 5,194,303
Supranationals 15,206,632 15,206,632
US Treasury Notes 102,979,963 102,979,963
Money Market Funds 1,395,376 1,395,376
Held by Trustee:
Money Market Funds 10,628,831 10,628,831
Total 261,207,207 $ 261,207,207
Uncategorized:
Local Agency Investment Fund 65,206,534
California Class 146,434,295
Total Uncategorized 211,640,829
Total Investments measured at Fair Value $ 472,848,036
The City and the third-party trustees that hold the City’s assets utilize the Market Approach
in valuing the investment portfolio through the use of a pricing service that utilized matrix
pricing. The market approach utilizes prices and other relevant data from market transactions
for similar assets.
59