
Page 79 - Moreno Valley 2025 Annual Financial Report
P. 79
City of Moreno Valley, California
Notes to Financial Statements
For the Year Ended June 30, 2025
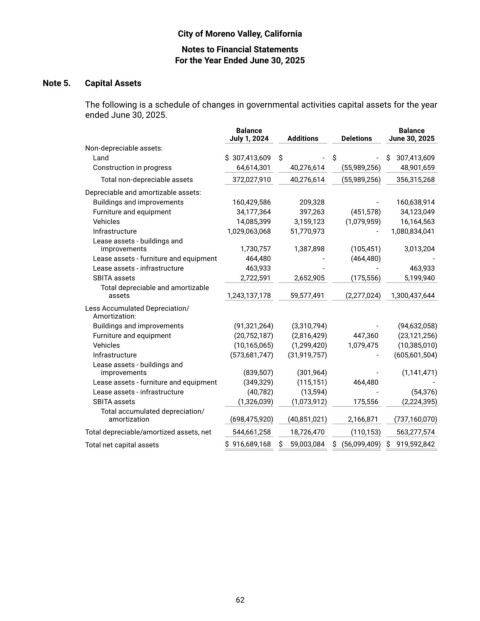
Note 5. Capital Assets
The following is a schedule of changes in governmental activities capital assets for the year
ended June 30, 2025.
Balance Balance
July 1, 2024 Additions Deletions June 30, 2025
Non-depreciable assets:
Land $ 307,413,609 $ - $ - $ 307,413,609
Construction in progress 64,614,301 40,276,614 (55,989,256) 48,901,659
Total non-depreciable assets 372,027,910 40,276,614 (55,989,256) 356,315,268
Depreciable and amortizable assets:
Buildings and improvements 160,429,586 209,328 - 160,638,914
Furniture and equipment 34,177,364 397,263 (451,578) 34,123,049
Vehicles 14,085,399 3,159,123 (1,079,959) 16,164,563
Infrastructure 1,029,063,068 51,770,973 - 1,080,834,041
Lease assets - buildings and
improvements 1,730,757 1,387,898 (105,451) 3,013,204
Lease assets - furniture and equipment 464,480 - (464,480) -
Lease assets - infrastructure 463,933 - - 463,933
SBITA assets 2,722,591 2,652,905 (175,556) 5,199,940
Total depreciable and amortizable
assets 1,243,137,178 59,577,491 (2,277,024) 1,300,437,644
Less Accumulated Depreciation/
Amortization:
Buildings and improvements (91,321,264) (3,310,794) - (94,632,058)
Furniture and equipment (20,752,187) (2,816,429) 447,360 (23,121,256)
Vehicles (10,165,065) (1,299,420) 1,079,475 (10,385,010)
Infrastructure (573,681,747) (31,919,757) - (605,601,504)
Lease assets - buildings and
improvements (839,507) (301,964) - (1,141,471)
Lease assets - furniture and equipment (349,329) (115,151) 464,480 -
Lease assets - infrastructure (40,782) (13,594) - (54,376)
SBITA assets (1,326,039) (1,073,912) 175,556 (2,224,395)
Total accumulated depreciation/
amortization (698,475,920) (40,851,021) 2,166,871 (737,160,070)
Total depreciable/amortized assets, net 544,661,258 18,726,470 (110,153) 563,277,574
Total net capital assets $ 916,689,168 $ 59,003,084 $ (56,099,409) $ 919,592,842
62