Page 80 - Moreno Valley 2025 Annual Financial Report
P. 80

City of Moreno Valley, California

                                               Notes to Financial Statements
                                              For the Year Ended June 30, 2025

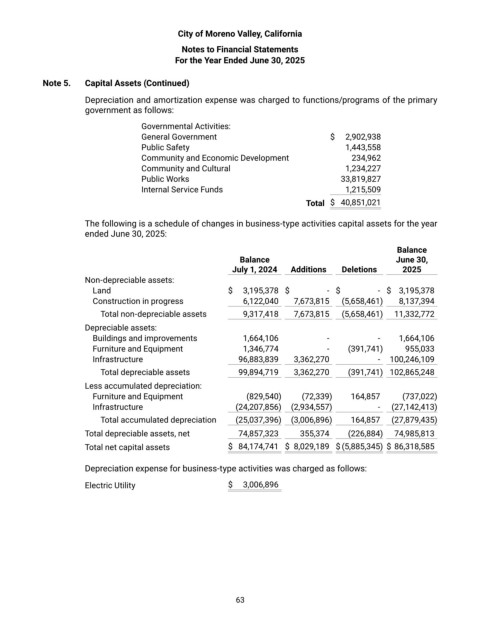
            Note 5.    Capital Assets (Continued)

                       Depreciation and amortization expense was charged to functions/programs of the primary
                       government as follows:

                                     Governmental Activities:
                                     General Government                                $   2,902,938
                                     Public Safety                                        1,443,558
                                     Community and Economic Development                    234,962
                                     Community and Cultural                               1,234,227
                                     Public Works                                         33,819,827
                                     Internal Service Funds                               1,215,509
                                                                               Total    $  40,851,021


                       The following is a schedule of changes in business-type activities capital assets for the year
                       ended June 30, 2025:

                                                                                                      Balance
                                                              Balance                                 June 30,
                                                            July 1, 2024   Additions   Deletions        2025
                       Non-depreciable assets:
                         Land                               $   3,195,378   $       -   $        -   $  3,195,378
                         Construction in progress              6,122,040     7,673,815     (5,658,461)     8,137,394
                           Total non-depreciable assets        9,317,418     7,673,815     (5,658,461)    11,332,772

                       Depreciable assets:
                         Buildings and improvements            1,664,106            -            -       1,664,106
                         Furniture and Equipment               1,346,774            -       (391,741)     955,033
                         Infrastructure                        96,883,839     3,362,270          -     100,246,109

                           Total depreciable assets            99,894,719     3,362,270      (391,741)   102,865,248
                       Less accumulated depreciation:
                         Furniture and Equipment                (829,540)     (72,339)     164,857      (737,022)
                         Infrastructure                       (24,207,856)    (2,934,557)        -      (27,142,413)
                           Total accumulated depreciation     (25,037,396)    (3,006,896)     164,857     (27,879,435)
                       Total depreciable assets, net           74,857,323      355,374      (226,884)    74,985,813

                       Total net capital assets             $  84,174,741   $  8,029,189   $ (5,885,345)  $ 86,318,585

                       Depreciation expense for business-type activities was charged as follows:

                       Electric Utility                     $   3,006,896


                                                             63
   75   76   77   78   79   80   81   82   83   84   85