
Page 35 - Moreno Valley 2025 Annual Financial Report
P. 35
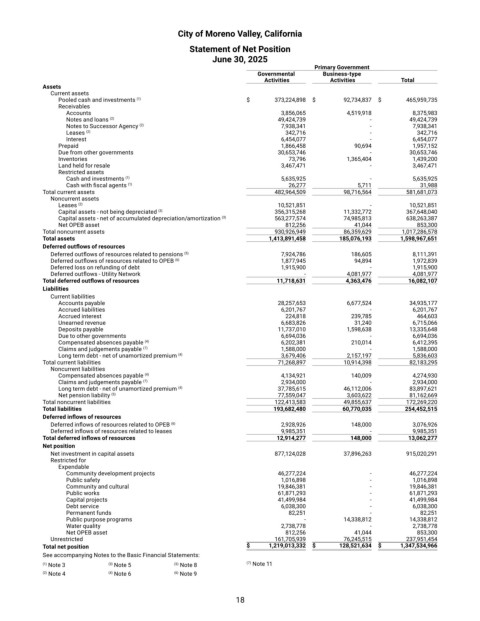
City of Moreno Valley, California

                                                 Statement of Net Position
                                                       June 30, 2025
                                                                                 Primary Government
                                                                   Governmental    Business-type
                                                                     Activities       Activities       Total
            Assets
              Current assets
                Pooled cash and investments  (1)                $      373,224,898   $   92,734,837   $   465,959,735
                Receivables
                  Accounts                                               3,856,065       4,519,918        8,375,983
                  Notes and loans  (2)                                  49,424,739             -         49,424,739
                  Notes to Successor Agency  (2)                         7,938,341             -          7,938,341
                  Leases  (2)                                             342,716              -           342,716
                  Interest                                               6,454,077             -          6,454,077
                Prepaid                                                  1,866,458         90,694         1,957,152
                Due from other governments                              30,653,746             -         30,653,746
                Inventories                                                73,796        1,365,404        1,439,200
                Land held for resale                                     3,467,471             -          3,467,471
                Restricted assets
                  Cash and investments  (1)                              5,635,925             -          5,635,925
                  Cash with fiscal agents  (1)                             26,277           5,711           31,988
            Total current assets                                       482,964,509       98,716,564       581,681,073
              Noncurrent assets
                Leases  (2)                                             10,521,851             -         10,521,851
                Capital assets ‐ not being depreciated  (3)            356,315,268       11,332,772       367,648,040
                Capital assets ‐ net of accumulated depreciation/amortization  (3)       563,277,574       74,985,813       638,263,387
                Net OPEB asset                                            812,256          41,044          853,300
            Total noncurrent assets                                    930,926,949       86,359,629       1,017,286,578
            Total assets                                              1,413,891,458     185,076,193     1,598,967,651
            Deferred outflows of resources
              Deferred outflows of resources related to pensions  (5)       7,924,786       186,605       8,111,391
              Deferred outflows of resources related to OPEB  (6)        1,877,945         94,894         1,972,839
              Deferred loss on refunding of debt                         1,915,900             -          1,915,900
              Deferred outflows ‐ Utility Network                              -         4,081,977        4,081,977
            Total deferred outflows of resources                        11,718,631       4,363,476       16,082,107
            Liabilities
              Current liabilities
                Accounts payable                                        28,257,653       6,677,524       34,935,177
                Accrued liabilities                                      6,201,767             -          6,201,767
                Accrued interest                                          224,818          239,785         464,603
                Unearned revenue                                         6,683,826         31,240         6,715,066
                Deposits payable                                        11,737,010       1,598,638       13,335,648
                Due to other governments                                 6,694,036             -          6,694,036
                Compensated absences payable  (4)                        6,202,381         210,014        6,412,395
                Claims and judgements payable  (7)                       1,588,000             -          1,588,000
                Long term debt ‐ net of unamortized premium  (4)         3,679,406       2,157,197        5,836,603
            Total current liabilities                                   71,268,897       10,914,398       82,183,295
              Noncurrent liabilities
                Compensated absences payable  (4)                        4,134,921         140,009        4,274,930
                Claims and judgements payable  (7)                       2,934,000             -          2,934,000
                Long term debt ‐ net of unamortized premium  (4)        37,785,615       46,112,006       83,897,621
                Net pension liability  (5)                              77,559,047       3,603,622       81,162,669
            Total noncurrent liabilities                               122,413,583       49,855,637       172,269,220
            Total liabilities                                          193,682,480      60,770,035      254,452,515
            Deferred inflows of resources
              Deferred inflows of resources related to OPEB  (6)         2,928,926         148,000        3,076,926
              Deferred inflows of resources related to leases            9,985,351             -          9,985,351
            Total deferred inflows of resources                         12,914,277        148,000        13,062,277
            Net position
              Net investment in capital assets                         877,124,028       37,896,263       915,020,291
              Restricted for
                Expendable
                  Community development projects                        46,277,224             -         46,277,224
                  Public safety                                          1,016,898             -          1,016,898
                  Community and cultural                                19,846,381             -         19,846,381
                  Public works                                          61,871,293             -         61,871,293
                  Capital projects                                      41,499,984             -         41,499,984
                  Debt service                                           6,038,300             -          6,038,300
                  Permanent funds                                          82,251              -            82,251
                  Public purpose programs                                      -         14,338,812       14,338,812
                  Water quality                                          2,738,778             -          2,738,778
                  Net OPEB asset                                          812,256          41,044          853,300
              Unrestricted                                             161,705,939       76,245,515       237,951,454
            Total net position                                  $     1,219,013,332     $  128,521,634     $  1,347,534,966
            See accompanying Notes to the Basic Financial Statements:
            (1)  Note 3      (3)  Note 5     (5)  Note 8         (7)  Note 11
            (2)  Note 4      (4)  Note 6     (6)  Note 9


                                                             18