
Page 31 - Moreno Valley 2025 Annual Financial Report
P. 31
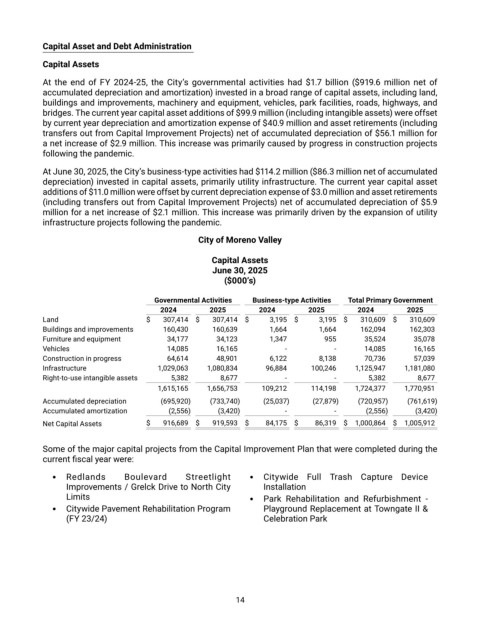
Capital Asset and Debt Administration

            Capital Assets

            At  the  end  of  FY  2024-25,  the  City’s  governmental  activities  had  $1.7  billion  ($919.6  million  net  of
            accumulated depreciation and amortization) invested in a broad range of capital assets, including land,
            buildings and improvements, machinery and equipment, vehicles, park facilities, roads, highways, and
            bridges. The current year capital asset additions of $99.9 million (including intangible assets) were offset
            by current year depreciation and amortization expense of $40.9 million and asset retirements (including
            transfers out from Capital Improvement Projects) net of accumulated depreciation of $56.1 million for
            a net increase of $2.9 million. This increase was primarily caused by progress in construction projects
            following the pandemic.
            At June 30, 2025, the City’s business-type activities had $114.2 million ($86.3 million net of accumulated
            depreciation) invested in capital assets, primarily utility infrastructure. The current year capital asset
            additions of $11.0 million were offset by current depreciation expense of $3.0 million and asset retirements
            (including transfers out from Capital Improvement Projects) net of accumulated depreciation of $5.9
            million for a net increase of $2.1 million. This increase was primarily driven by the expansion of utility
            infrastructure projects following the pandemic.

                                                    City of Moreno Valley

                                                       Capital Assets
                                                       June 30, 2025
                                                          ($000’s)

                                        Governmental Activities     Business-type Activities    Total Primary Government
                                          2024        2025         2024         2025        2024         2025
            Land                       $   307,414   $   307,414   $   3,195   $   3,195   $   310,609   $   310,609
            Buildings and improvements       160,430      160,639      1,664      1,664      162,094      162,303
            Furniture and equipment         34,177      34,123        1,347         955       35,524       35,078
            Vehicles                        14,085      16,165            -           -       14,085       16,165
            Construction in progress        64,614      48,901        6,122       8,138       70,736       57,039
            Infrastructure                1,029,063      1,080,834      96,884      100,246      1,125,947      1,181,080
            Right-to-use intangible assets      5,382      8,677          -           -        5,382        8,677
                                          1,615,165      1,656,753      109,212      114,198      1,724,377      1,770,951
            Accumulated depreciation       (695,920)     (733,740)     (25,037)     (27,879)     (720,957)     (761,619)
            Accumulated amortization        (2,556)      (3,420)          -           -       (2,556)      (3,420)
            Net Capital Assets         $   916,689   $   919,593   $   84,175   $   86,319   $  1,000,864   $  1,005,912


            Some of the major capital projects from the Capital Improvement Plan that were completed during the
            current fiscal year were:

                 •  Redlands     Boulevard      Streetlight         •  Citywide  Full  Trash  Capture  Device
                  Improvements / Grelck Drive to North City         Installation
                  Limits                                            •  Park  Rehabilitation  and  Refurbishment  -
                 •  Citywide Pavement Rehabilitation Program        Playground Replacement at Towngate II &
                  (FY 23/24)                                        Celebration Park


                                                             14