
Page 27 - Moreno Valley 2025 Annual Financial Report
P. 27
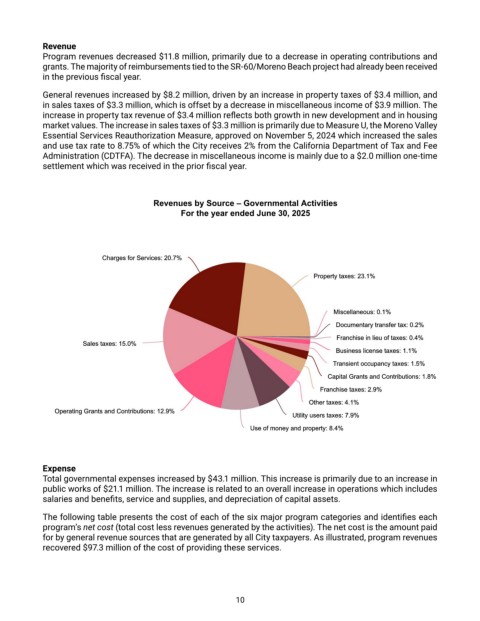
Revenue
Program revenues decreased $11.8 million, primarily due to a decrease in operating contributions and
grants. The majority of reimbursements tied to the SR-60/Moreno Beach project had already been received
in the previous fiscal year.
General revenues increased by $8.2 million, driven by an increase in property taxes of $3.4 million, and
in sales taxes of $3.3 million, which is offset by a decrease in miscellaneous income of $3.9 million. The
increase in property tax revenue of $3.4 million reflects both growth in new development and in housing
market values. The increase in sales taxes of $3.3 million is primarily due to Measure U, the Moreno Valley
Essential Services Reauthorization Measure, approved on November 5, 2024 which increased the sales
and use tax rate to 8.75% of which the City receives 2% from the California Department of Tax and Fee
Administration (CDTFA). The decrease in miscellaneous income is mainly due to a $2.0 million one-time
settlement which was received in the prior fiscal year.
Revenues by Source – Governmental Activities
For the year ended June 30, 2025
Charges for Services: 20.7%
C h a r g e s f o r S e r v i c e s : 2 0 . 7 %
p
2
o
:
e
r
P
Property taxes: 23.1%
.
%
1
3
y
a
x
t
e
r
s
t
:
u
s
%
e
1
0
.
Miscellaneous: 0.1%
M
n
a
l
e
o
c
s
i
l
a
x
t
r
n
o
a
:
m
Documentary transfer tax: 0.2%
t
a
y
r
D
e
.
n
0
2
%
c
u
r
e
t
s
f
Franchise in lieu of taxes: 0.4%
F r a n c h i s e i n l i e u o f t a x e s : 0 . 4 %
Sales taxes: 15.0%
S a l e s t a x e s : 1 5 . 0 %
Business license taxes: 1.1%
B u s i n e s s l i c e n s e t a x e s : 1 . 1 %
T r a n s i e n t o c c u p a n c y t a x e s : 1 . 5 %
Transient occupancy taxes: 1.5%
C a p i t a l G r a n t s a n d C o n t r i b u t i o n s : 1 . 8 %
Capital Grants and Contributions: 1.8%
r
x
a
e
s
i
e
t
a
n
h
c
F
9
%
s
:
2
.
Franchise taxes: 2.9%
O
Other taxes: 4.1%ther taxes: 4.1%
r
O
.
2
o
n
1
t
t
:
i
%
o
Operating Grants and Contributions: 12.9%
i
9
u
b
a
n
d
s
n
a
r
t
G
s
r
C
e
n
p
n
g
i
a
t
%
9
.
u
y
s
s
r
e
t
U
Utility users taxes: 7.9%
i
t
i
l
e
x
a
s
7
:
t
e
o
n
a
y
y
m
s
e
Use of money and property: 8.4%
U
f
o
r
p
.
p
e
o
8
t
d
:
n
4
r
%
Expense
Total governmental expenses increased by $43.1 million. This increase is primarily due to an increase in
public works of $21.1 million. The increase is related to an overall increase in operations which includes
salaries and benefits, service and supplies, and depreciation of capital assets.
The following table presents the cost of each of the six major program categories and identifies each
program’s net cost (total cost less revenues generated by the activities). The net cost is the amount paid
for by general revenue sources that are generated by all City taxpayers. As illustrated, program revenues
recovered $97.3 million of the cost of providing these services.
10