
Page 24 - Moreno Valley 2025 Annual Financial Report
P. 24
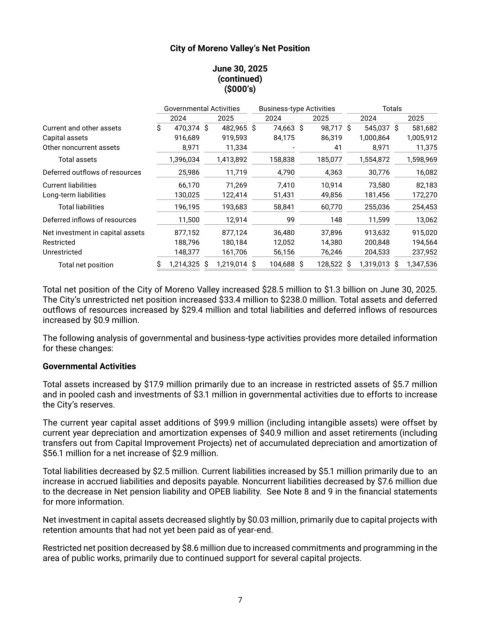
City of Moreno Valley’s Net Position

                                                       June 30, 2025
                                                         (continued)
                                                          ($000’s)

                                           Governmental Activities     Business-type Activities     Totals
                                            2024         2025        2024        2025        2024        2025
            Current and other assets       $   470,374   $   482,965   $   74,663   $   98,717   $   545,037   $   581,682
            Capital assets                     916,689       919,593       84,175       86,319       1,000,864       1,005,912
            Other noncurrent assets            8,971       11,334           -         41        8,971       11,375
                Total assets                   1,396,034       1,413,892       158,838       185,077       1,554,872       1,598,969
            Deferred outflows of resources         25,986       11,719       4,790       4,363       30,776       16,082
            Current liabilities                66,170       71,269       7,410       10,914       73,580       82,183
            Long-term liabilities              130,025       122,414       51,431       49,856       181,456       172,270
                Total liabilities              196,195       193,683       58,841       60,770       255,036       254,453
            Deferred inflows of resources         11,500       12,914       99       148       11,599       13,062
            Net investment in capital assets         877,152       877,124       36,480       37,896       913,632       915,020
            Restricted                         188,796       180,184       12,052       14,380       200,848       194,564
            Unrestricted                       148,377       161,706       56,156       76,246       204,533       237,952
                Total net position          $  1,214,325    $  1,219,014    $   104,688    $   128,522    $  1,319,013    $  1,347,536


            Total net position of the City of Moreno Valley increased $28.5 million to $1.3 billion on June 30, 2025.
            The City’s unrestricted net position increased $33.4 million to $238.0 million. Total assets and deferred
            outflows of resources increased by $29.4 million and total liabilities and deferred inflows of resources
            increased by $0.9 million.

            The following analysis of governmental and business-type activities provides more detailed information
            for these changes:

            Governmental Activities

            Total assets increased by $17.9 million primarily due to an increase in restricted assets of $5.7 million
            and in pooled cash and investments of $3.1 million in governmental activities due to efforts to increase
            the City’s reserves.
            The current year capital asset additions of $99.9 million (including intangible assets) were offset by
            current year depreciation and amortization expenses of $40.9 million and asset retirements (including
            transfers out from Capital Improvement Projects) net of accumulated depreciation and amortization of
            $56.1 million for a net increase of $2.9 million.

            Total liabilities decreased by $2.5 million. Current liabilities increased by $5.1 million primarily due to  an
            increase in accrued liabilities and deposits payable. Noncurrent liabilities decreased by $7.6 million due
            to the decrease in Net pension liability and OPEB liability.  See Note 8 and 9 in the financial statements
            for more information.

            Net investment in capital assets decreased slightly by $0.03 million, primarily due to capital projects with
            retention amounts that had not yet been paid as of year-end.
            Restricted net position decreased by $8.6 million due to increased commitments and programming in the
            area of public works, primarily due to continued support for several capital projects.


                                                              7