
Page 29 - Moreno Valley 2025 Annual Financial Report
P. 29
Financial Analysis of the Fund Statements
Funds are accounting devices that the City uses to keep track of specific sources of funding and spending
for particular purposes. The fund financial statements focus on individual parts of City governments,
reporting City operations in more detail than the government-wide statements.
Total fund balances presented in the governmental funds balance sheet are $292.7 million, with the
General Fund representing $114.4 million, or 39.1% of the total. The City’s General Fund has an unassigned
fund balance of $30.8 million.
General Fund Budgetary Highlights
The General Fund was anticipated to have a balanced budget resulting in minimal change in fund balance.
Actual results of total fund balance increased by $10.2 million. Compared to the budget, actual results
realized a revenue increase of $21.0 million and expenditure reduction of $5.1 million. The operating
reserve increased to $24.3 million, and the economic uncertainty increased to $24.3 million. These
reserves are maintained at adequate levels per the City Council adopted policy to mitigate financial risk
that can occur from unforeseen revenue fluctuations, unanticipated expenditures, major emergencies,
or a catastrophic event.
Original budget compared to final budget. The General fund revenue final budget increased $3.6 million
primarily due to increase in property taxes of $3.3 million due to an expectation in growth in housing
market values and continued economic development.
Final budget compared to actual results. The General Fund revenues were $21.0 million more than what
was anticipated in the final budget, mainly due to an increase in use of money and property of $12.0
million, in utility users taxes of $3.6 million, and in sales taxes of $3.4 million. These gains were largely
driven by higher investment interest income, an increase in unrealized GASB 31 gains from an improving
investment portfolio holdings, growth in housing market values and continued economic development,
and an increase in the sales tax rate.
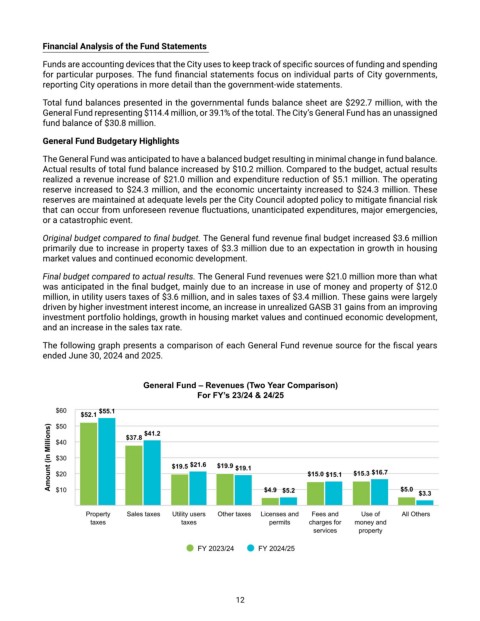
The following graph presents a comparison of each General Fund revenue source for the fiscal years
ended June 30, 2024 and 2025.
General Fund – Revenues (Two Year Comparison)
For FY’s 23/24 & 24/25
$60 $55.1
$52.1 $41.2
$50
Amount (in Millions) $40 $37.8 $19.5 $21.6 $19.9 $19.1 $15.0 $15.1 $15.3 $16.7
$30
$20
$10
$4.9 $5.2
All Others
Property Sales taxes Utility users Other taxes Licenses and Fees and Use of $5.0 $3.3
taxes taxes permits charges for money and
services property
FY 2023/24 FY 2024/25
12