
Page 26 - Moreno Valley 2025 Annual Financial Report
P. 26
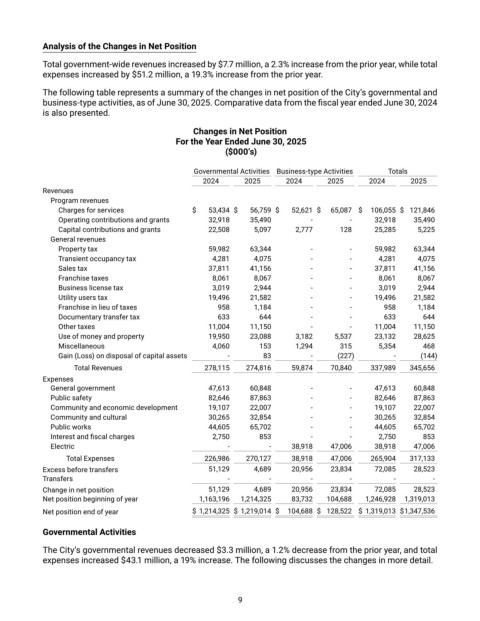
Analysis of the Changes in Net Position

            Total government-wide revenues increased by $7.7 million, a 2.3% increase from the prior year, while total
            expenses increased by $51.2 million, a 19.3% increase from the prior year.

            The following table represents a summary of the changes in net position of the City’s governmental and
            business-type activities, as of June 30, 2025. Comparative data from the fiscal year ended June 30, 2024
            is also presented.

                                                  Changes in Net Position
                                              For the Year Ended June 30, 2025
                                                           ($000’s)

                                                   Governmental Activities   Business-type Activities    Totals
                                                     2024      2025       2024       2025      2024       2025
            Revenues
              Program revenues
                Charges for services               $   53,434  $   56,759  $   52,621  $   65,087   $  106,055  $  121,846
                Operating contributions and grants       32,918     35,490      -         -       32,918     35,490
                Capital contributions and grants       22,508     5,097     2,777       128      25,285     5,225
              General revenues
                Property tax                          59,982     63,344         -         -       59,982     63,344
                Transient occupancy tax                4,281      4,075         -         -       4,281     4,075
                Sales tax                             37,811     41,156         -         -       37,811     41,156
                Franchise taxes                        8,061      8,067         -         -       8,061     8,067
                Business license tax                   3,019      2,944         -         -       3,019     2,944
                Utility users tax                     19,496     21,582         -         -       19,496     21,582
                Franchise in lieu of taxes               958      1,184         -         -        958      1,184
                Documentary transfer tax                 633       644          -         -        633       644
                Other taxes                           11,004     11,150         -         -       11,004     11,150
                Use of money and property             19,950     23,088     3,182     5,537      23,132     28,625
                Miscellaneous                          4,060       153      1,294       315       5,354      468
                Gain (Loss) on disposal of capital assets     -       83        -       (227)        -       (144)
                    Total Revenues                    278,115     274,816     59,874     70,840      337,989     345,656
            Expenses
              General government                      47,613     60,848         -         -       47,613     60,848
              Public safety                           82,646     87,863         -         -       82,646     87,863
              Community and economic development       19,107     22,007        -         -       19,107     22,007
              Community and cultural                  30,265     32,854         -         -       30,265     32,854
              Public works                            44,605     65,702         -         -       44,605     65,702
              Interest and fiscal charges              2,750       853          -         -       2,750      853
              Electric                                     -          -       38,918     47,006      38,918     47,006
                  Total Expenses                      226,986     270,127     38,918     47,006      265,904     317,133
            Excess before transfers                   51,129      4,689     20,956     23,834      72,085     28,523
            Transfers                                      -          -         -         -          -         -
            Change in net position                    51,129      4,689     20,956     23,834      72,085     28,523
            Net position beginning of year           1,163,196    1,214,325     83,732     104,688     1,246,928    1,319,013
            Net position end of year               $  1,214,325  $  1,219,014  $  104,688  $  128,522   $  1,319,013  $ 1,347,536

            Governmental Activities

            The City’s governmental revenues decreased $3.3 million, a 1.2% decrease from the prior year, and total
            expenses increased $43.1 million, a 19% increase. The following discusses the changes in more detail.


                                                              9