
Page 28 - Moreno Valley 2025 Annual Financial Report
P. 28
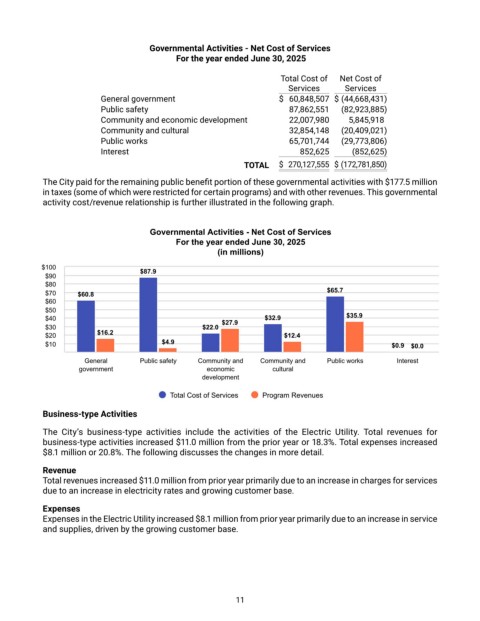
Governmental Activities - Net Cost of Services
                                              For the year ended June 30, 2025


                                                                         Total Cost of   Net Cost of
                                                                           Services      Services
                           General government                           $  60,848,507  $ (44,668,431)
                           Public safety                                  87,862,551    (82,923,885)
                           Community and economic development             22,007,980      5,845,918
                           Community and cultural                         32,854,148    (20,409,021)
                           Public works                                   65,701,744    (29,773,806)
                           Interest                                           852,625      (852,625)
                                                               TOTAL  $  270,127,555  $ (172,781,850)

            The City paid for the remaining public benefit portion of these governmental activities with $177.5 million
            in taxes (some of which were restricted for certain programs) and with other revenues. This governmental
            activity cost/revenue relationship is further illustrated in the following graph.


                                       Governmental Activities - Net Cost of Services
                                              For the year ended June 30, 2025
                                                        (in millions)

            $100                     $87.9
            $90
            $80
            $70      $60.8                                                          $65.7
            $60
            $50
            $40                                           $27.9      $32.9               $35.9
            $30                                      $22.0
            $20           $16.2                                          $12.4
            $10                           $4.9                                                       $0.9  $0.0

                      General        Public safety  Community and  Community and    Public works      Interest
                     government                       economic        cultural
                                                     development

                                            Total Cost of Services  Program Revenues

            Business-type Activities

            The  City’s  business-type  activities  include  the  activities  of  the  Electric  Utility.  Total  revenues  for
            business-type activities increased $11.0 million from the prior year or 18.3%. Total expenses increased
            $8.1 million or 20.8%. The following discusses the changes in more detail.

            Revenue
            Total revenues increased $11.0 million from prior year primarily due to an increase in charges for services
            due to an increase in electricity rates and growing customer base.

            Expenses
            Expenses in the Electric Utility increased $8.1 million from prior year primarily due to an increase in service
            and supplies, driven by the growing customer base.


                                                             11