Page 37 - Moreno Valley 2025 Annual Financial Report
P. 37

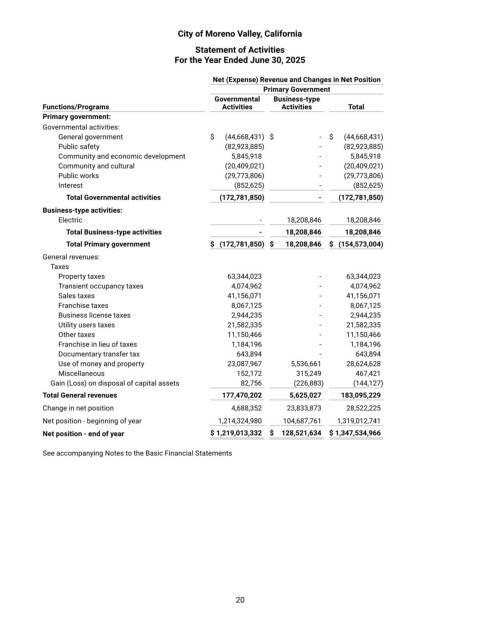
City of Moreno Valley, California

                                                   Statement of Activities
                                              For the Year Ended June 30, 2025


                                                       Net (Expense) Revenue and Changes in Net Position
                                                                    Primary Government
                                                        Governmental   Business‐type
            Functions/Programs                            Activities     Activities       Total
            Primary government:
            Governmental activities:
                General government                      $   (44,668,431)   $      -    $   (44,668,431)
                Public safety                              (82,923,885)           -        (82,923,885)
                Community and economic development          5,845,918             -        5,845,918
                Community and cultural                     (20,409,021)           -        (20,409,021)
                Public works                               (29,773,806)           -        (29,773,806)
                Interest                                     (852,625)            -        (852,625)
                  Total Governmental activities           (172,781,850)           -      (172,781,850)
            Business‐type activities:
                Electric                                           -        18,208,846       18,208,846
                  Total Business‐type activities                   -      18,208,846      18,208,846
                  Total Primary government              $  (172,781,850)   $  18,208,846    $  (154,573,004)
            General revenues:
              Taxes
                Property taxes                             63,344,023             -        63,344,023
                Transient occupancy taxes                   4,074,962             -        4,074,962
                Sales taxes                                41,156,071             -        41,156,071
                Franchise taxes                             8,067,125             -        8,067,125
                Business license taxes                      2,944,235             -        2,944,235
                Utility users taxes                        21,582,335             -        21,582,335
                Other taxes                                11,150,466             -        11,150,466
                Franchise in lieu of taxes                  1,184,196             -        1,184,196
                Documentary transfer tax                     643,894              -         643,894
                Use of money and property                  23,087,967       5,536,661       28,624,628
                Miscellaneous                                152,172         315,249        467,421
              Gain (Loss) on disposal of capital assets       82,756        (226,883)      (144,127)
            Total General revenues                        177,470,202      5,625,027      183,095,229
            Change in net position                          4,688,352       23,833,873       28,522,225
            Net position ‐ beginning of year             1,214,324,980       104,687,761      1,319,012,741
            Net position ‐ end of year                 $ 1,219,013,332     $  128,521,634     $ 1,347,534,966

            See accompanying Notes to the Basic Financial Statements


                                                             20
   32   33   34   35   36   37   38   39   40   41   42