Page 42 - Moreno Valley 2025 Annual Financial Report
P. 42

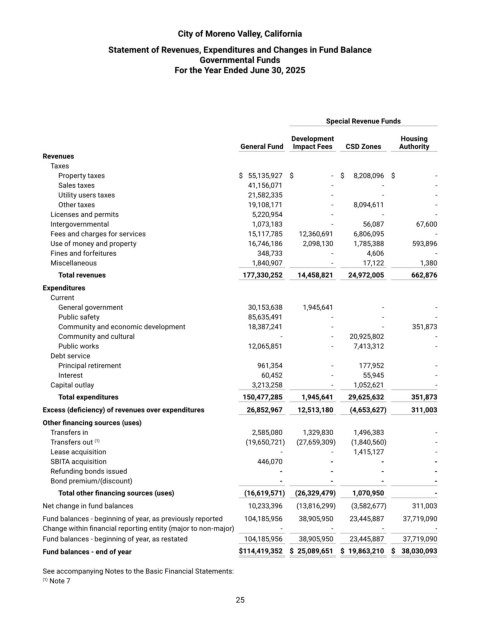
City of Moreno Valley, California

                             Statement of Revenues, Expenditures and Changes in Fund Balance
                                                    Governmental Funds
                                              For the Year Ended June 30, 2025


                                                                                    Special Revenue Funds

                                                                           Development                 Housing
                                                               General Fund   Impact Fees    CSD Zones    Authority
            Revenues
              Taxes
                Property taxes                                  $  55,135,927    $    -    $   8,208,096    $   -
                Sales taxes                                         41,156,071        -           -             -
                Utility users taxes                                 21,582,335        -           -             -
                Other taxes                                         19,108,171        -         8,094,611        -
              Licenses and permits                                  5,220,954         -           -             -
              Intergovernmental                                     1,073,183         -         56,087        67,600
              Fees and charges for services                         15,117,785        12,360,691        6,806,095        -
              Use of money and property                             16,746,186        2,098,130        1,785,388        593,896
              Fines and forfeitures                                 348,733           -         4,606           -
              Miscellaneous                                         1,840,907         -         17,122        1,380

                Total revenues                                   177,330,252     14,458,821     24,972,005      662,876


            Expenditures
              Current
                General government                                  30,153,638        1,945,641        -         -
                Public safety                                       85,635,491        -           -             -
                Community and economic development                  18,387,241        -           -         351,873
                Community and cultural                                   -            -         20,925,802        -
                Public works                                        12,065,851        -         7,413,312        -
              Debt service
                Principal retirement                                961,354           -         177,952         -
                Interest                                            60,452            -         55,945          -
              Capital outlay                                        3,213,258         -         1,052,621        -

                Total expenditures                               150,477,285      1,945,641     29,625,632      351,873

            Excess (deficiency) of revenues over expenditures      26,852,967     12,513,180      (4,653,627)     311,003


            Other financing sources (uses)
              Transfers in                                          2,585,080      1,329,830      1,496,383      -


              Transfers out  (1)                                 (19,650,721)    (27,659,309)       (1,840,560)       -
              Lease acquisition                                          -            -         1,415,127        -
              SBITA acquisition                                     446,070          -            -             -
              Refunding bonds issued                                    -            -            -             -
              Bond premium/(discount)                                   -            -            -             -

                Total other financing sources (uses)             (16,619,571)    (26,329,479)     1,070,950      -


            Net change in fund balances                           10,233,396     (13,816,299)       (3,582,677)       311,003
            Fund balances - beginning of year, as previously reported      104,185,956        38,905,950        23,445,887        37,719,090

            Change within financial reporting entity (major to non-major)       -         -         -           -

            Fund balances - beginning of year, as restated       104,185,956        38,905,950        23,445,887        37,719,090
            Fund balances - end of year                          $ 114,419,352     $  25,089,651     $  19,863,210     $  38,030,093

            See accompanying Notes to the Basic Financial Statements:
            (1)  Note 7

                                                             25
   37   38   39   40   41   42   43   44   45   46   47